Smoothly integrate sophisticated liquidity data into your analysis.
Deep Dive Stocks creates cutting-edge liquidity frameworks and algorithms to remove uncertainty and bias while providing predictive indicators and alerts to help traders idenitfy high-quality opportunities.
Access your real-time liquidity data with your new indicators, alerts, and community.
Your tools should be powerful and predictive, yet simple ands straightforward. Below, you will see the indicators available to you as a member of Deep Dive Stocks that are exactly that.
Liquidity Status
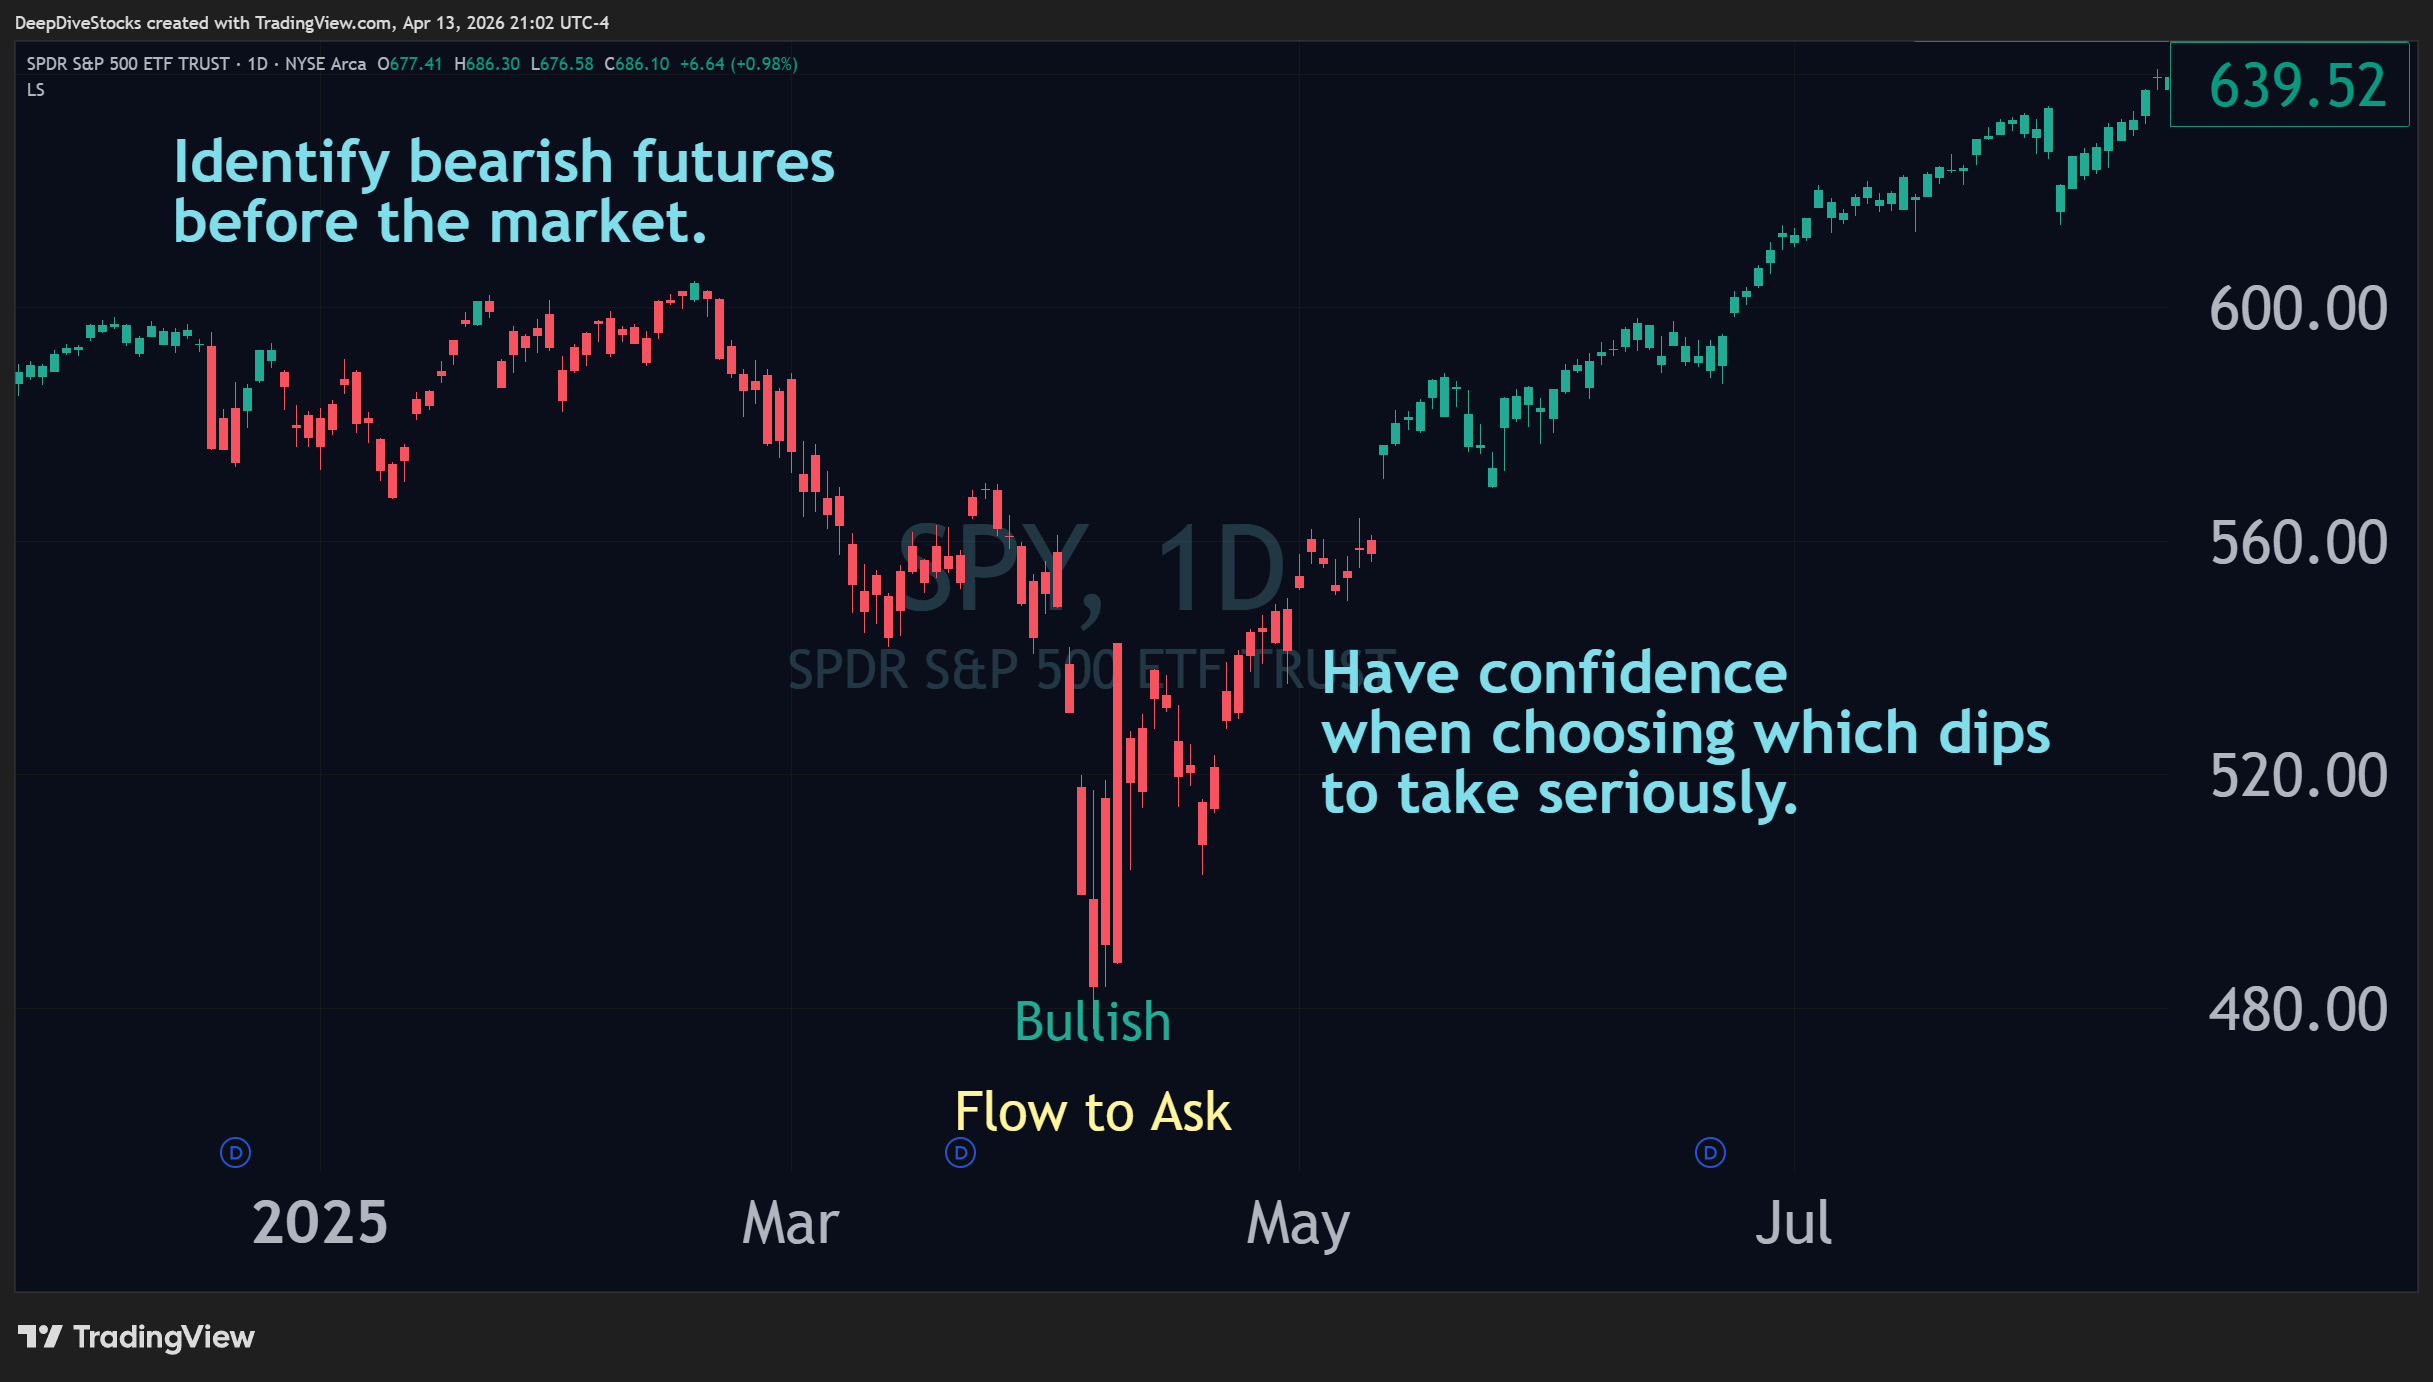
Utilizing TradingView's charting, Liquidity Status colors candles red or green. Red if liquidity suggests the future looks bearish, and green if the future looks bullish. Its that simple! Green means up, red means down (in the future - remember, Deep Dive Stocks' tools are predictive).
Learn More ⟶Liquidity Triggers
Finding Supports and Resistances is a critical part of analyzing the stock market, and that is why Deep Dive Stocks has developed a system of identifying high-impact levels before traditional and standard metrics are able to - so that you have ample time to plan and position.
Learn More ⟶Liquidity Toolkit
The Liquidity Toolkit is the swiss-army knife of liquidity with focus on identifying, catagorizing and producing alerts on budding opportunities in the market, in real-time so that you can focus on what matters, planning and positioning.
Learn More ⟶Volatility OverExposure
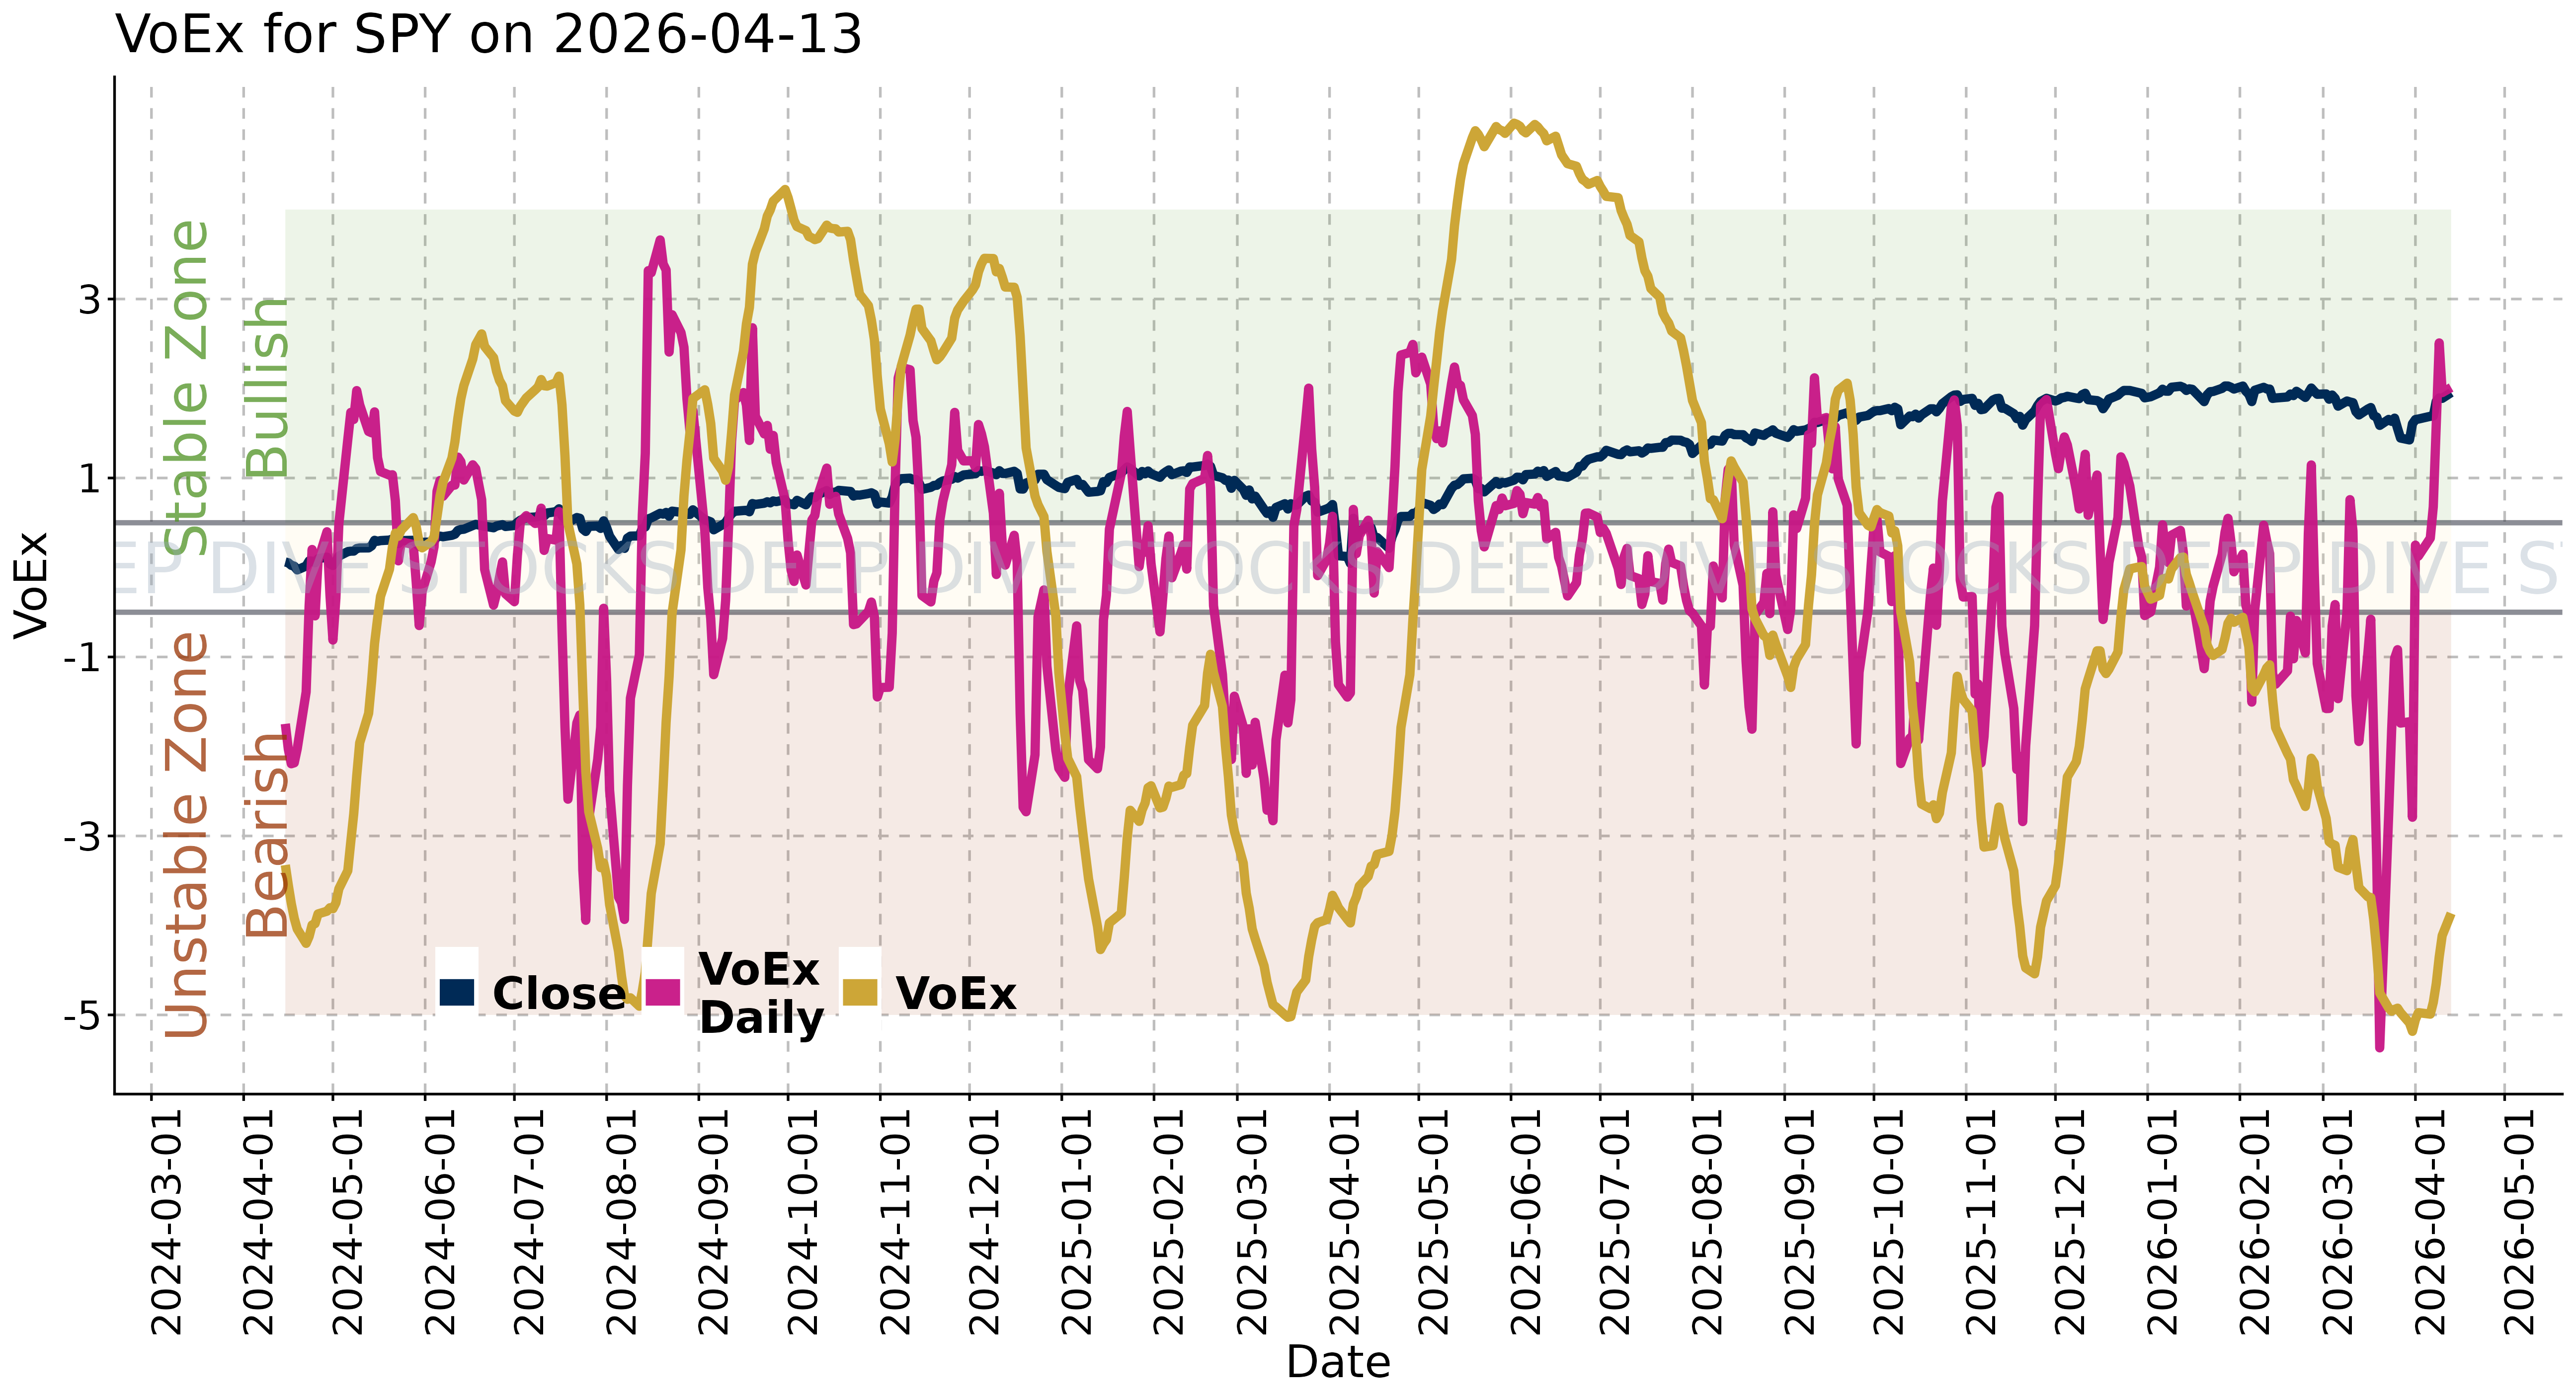
VoEx combines institutional hedging behavior with liquidity analysis to identify periods of instability and stability. VoEx is a predictive indicator available for over a thousand symbols through a simple discord command.
Learn More ⟶Discord Community
Connect with other data-heads and analyze the stock market with your sophisticated tools to identify unique opportunities, configure personalized reports, and take advantage of the Databot commands to bring liquidity insights with you, wherever you go.
Learn More ⟶Let Deep Dive Stocks' tools Simplify your data analysis, cut through the stress of uncertainty, and oversee large swaths of the market so that you can focus on execution with confidence.
Simplify
You don't have to juggle a thousand indicators and chart patterns all the time - sometimes it is nice to simply know if an equity is likely going to go up or down. This is exactly what Deep Dive Stocks has developed: green means up, red means down.
Learn More ⟶Anxiolyse
Data should make you feel confident, not over-burdened, adn that is exactly what Deep Dive Stocks has waiting for you: confidence int he future, founded on high quality, predictive liquidity data.
Learn More ⟶Oversee
The market is big adn there are endless opportunities but it is a chore hunting them down. Let Deep Dive Stocks' personalized alerts and algorithms find the ripest fruit for you, so you can focus on planning and executing with confidence. Deep Dive Stocks has taken all of the tedium out of the process of finding opportunities and managing risk so that you can focus on what matters: your portfolio.
Learn More ⟶Your tools should fit your trading style, not the other way around.
Traders should focus on capturing market events, not constantly worrying about their set-ups - Deep Dive Stocks' tools seemlessly fit a variety of trading styles and purposes.
the Datahead
Dig into the data to correlate liquidity changes, price behaviors, and news-reporting to build a comprehensive map of the market's flows, and then dive in when the tide is highest. Dataheads value understanding, complex data synthesis, and undertanding the whole picture, and to be most effective, they need high quality data.
Learn More ⟶the Scalper
From entering and exiting before the market even knows a change has occured, to surfing turbulence, scalpers find home in the responsive yet clean signals that produce repeatable result with their fast reflexes and clear vision. Indicators with minimal noise is paramount to scalpers so they can focus on execution.
Learn More ⟶the Opportunist
When big events are coming up, positioning is critical - Deep Dive Stocks' liquidity data allows for just that without worrying about the news cycle or loudest narrative. Anticipate market reaction by monitoring the market's real positioning as important events approach.
Learn More ⟶Reduce Stress, Increase Confidence
The market is stressful enough without worrying about if your indicators are appropriately set or anchored - let Deep Dive Stocks' liquidity algorithms reduce the noise, not add to it.
Insecurity breeds Indecision
Deep Dive Stocks' tools and indicators are like satalites that take pictures from space: they use the same angle, the same settings, everytime so that you can focus on real data changes and not noise.

VoEx is designed to inspire confidence in decision-making without losing sensitivity to the important events in the market (including those behind happening the scenes!). Despite the complexity of the data, the takeaway is simple: just look to see what zone VoEx is in.

Indecision may live with traditional metrics, but with Deep Dive Stocks' liquidity insights, not only is finding opportunities less stressful, picking between them even more so.

There's no need to worry about missing opportunities with the Databot hosted in the Deep Dive Stocks' discord server - being directly notified via DM that something has changed allows you to focus on what matters: planning an executing.
- Indicators that change when a change that matters has occured - with customizable risk ajustments available for every risk apetite.
- The Liquidity Triggers are capable of detecting profit-takers, dip-buyers, aggressive hedging, and many more factors that ordinarily lay hidden and can adversely impact price action.
- When VoEx is in the bullish zone, the future outlook is bullish - time and time again.
- Worrying about missing an opportunity or an important change is drastically reduced thanks to the Databot's alerting system and the Recovery Opportunity Alerts.
- The Liquidity Toolkit, Liquidty Status, and Liquidity Trigger indicators all come with over 20 specialized alerts to help you filter noise from signal in the market.
Stabilze your view to build stable models.
Fostering powerful and accurate pattern-recognition, the data needs to be consistent: consistently measured and consistently displayed to reduce variance and random noise.

Every chart, every interval is captured from the same vantage point, like a statlite taking picutres from high above. When you see how an Aggressive Ask cascade behaves on the 30-second, you have seen how all Aggressive Ask cascades behave on all intervals.

It doesn't matter what class of instrument or what interval, Deep Dive Stocks has ensured that the data is always appropriately measured and formatted so that you can be confident in what you are measuring.

When you see an Aggressive Ask Cascade, or Aggressive Bid Cascade or get an alert from one of Deep Dive Stocks' market-monitoring algorithms, you can be confident that nothing has shifted or been nudged - the data and expectations are exactly the same as the last time, and the time before that.
- The Liquidity Triggers are designed to take the same photo, from the same place, every time - all you have to do is point and click.
- Aggressive Ask and Aggressive Bid cascades are unique events that can only be identified with the Liquidity Status and Liquidity Trigger indicators.
- Repetitive data produces repetitive outcomes, fostering confidence in future expectations.
Additional insights, less anxiety - the way data is meant to be.
Coherence and Understanding
Understanding before action - observation before assumption; the Datahead weaves multiple data streams into a comprehensive and robust mental model for navigating the markets.
Data Synthesis
Dataheads excel and sythesizing an internal map of the market through taking in multiple information streams, from the news, the earnings reports, traditional TA set ups, and likely, some homebrewed models to navigate the market with confidence.

Liquidity Status-colored price-candles can highlight directional preferrence while VWAP paints its boundries.
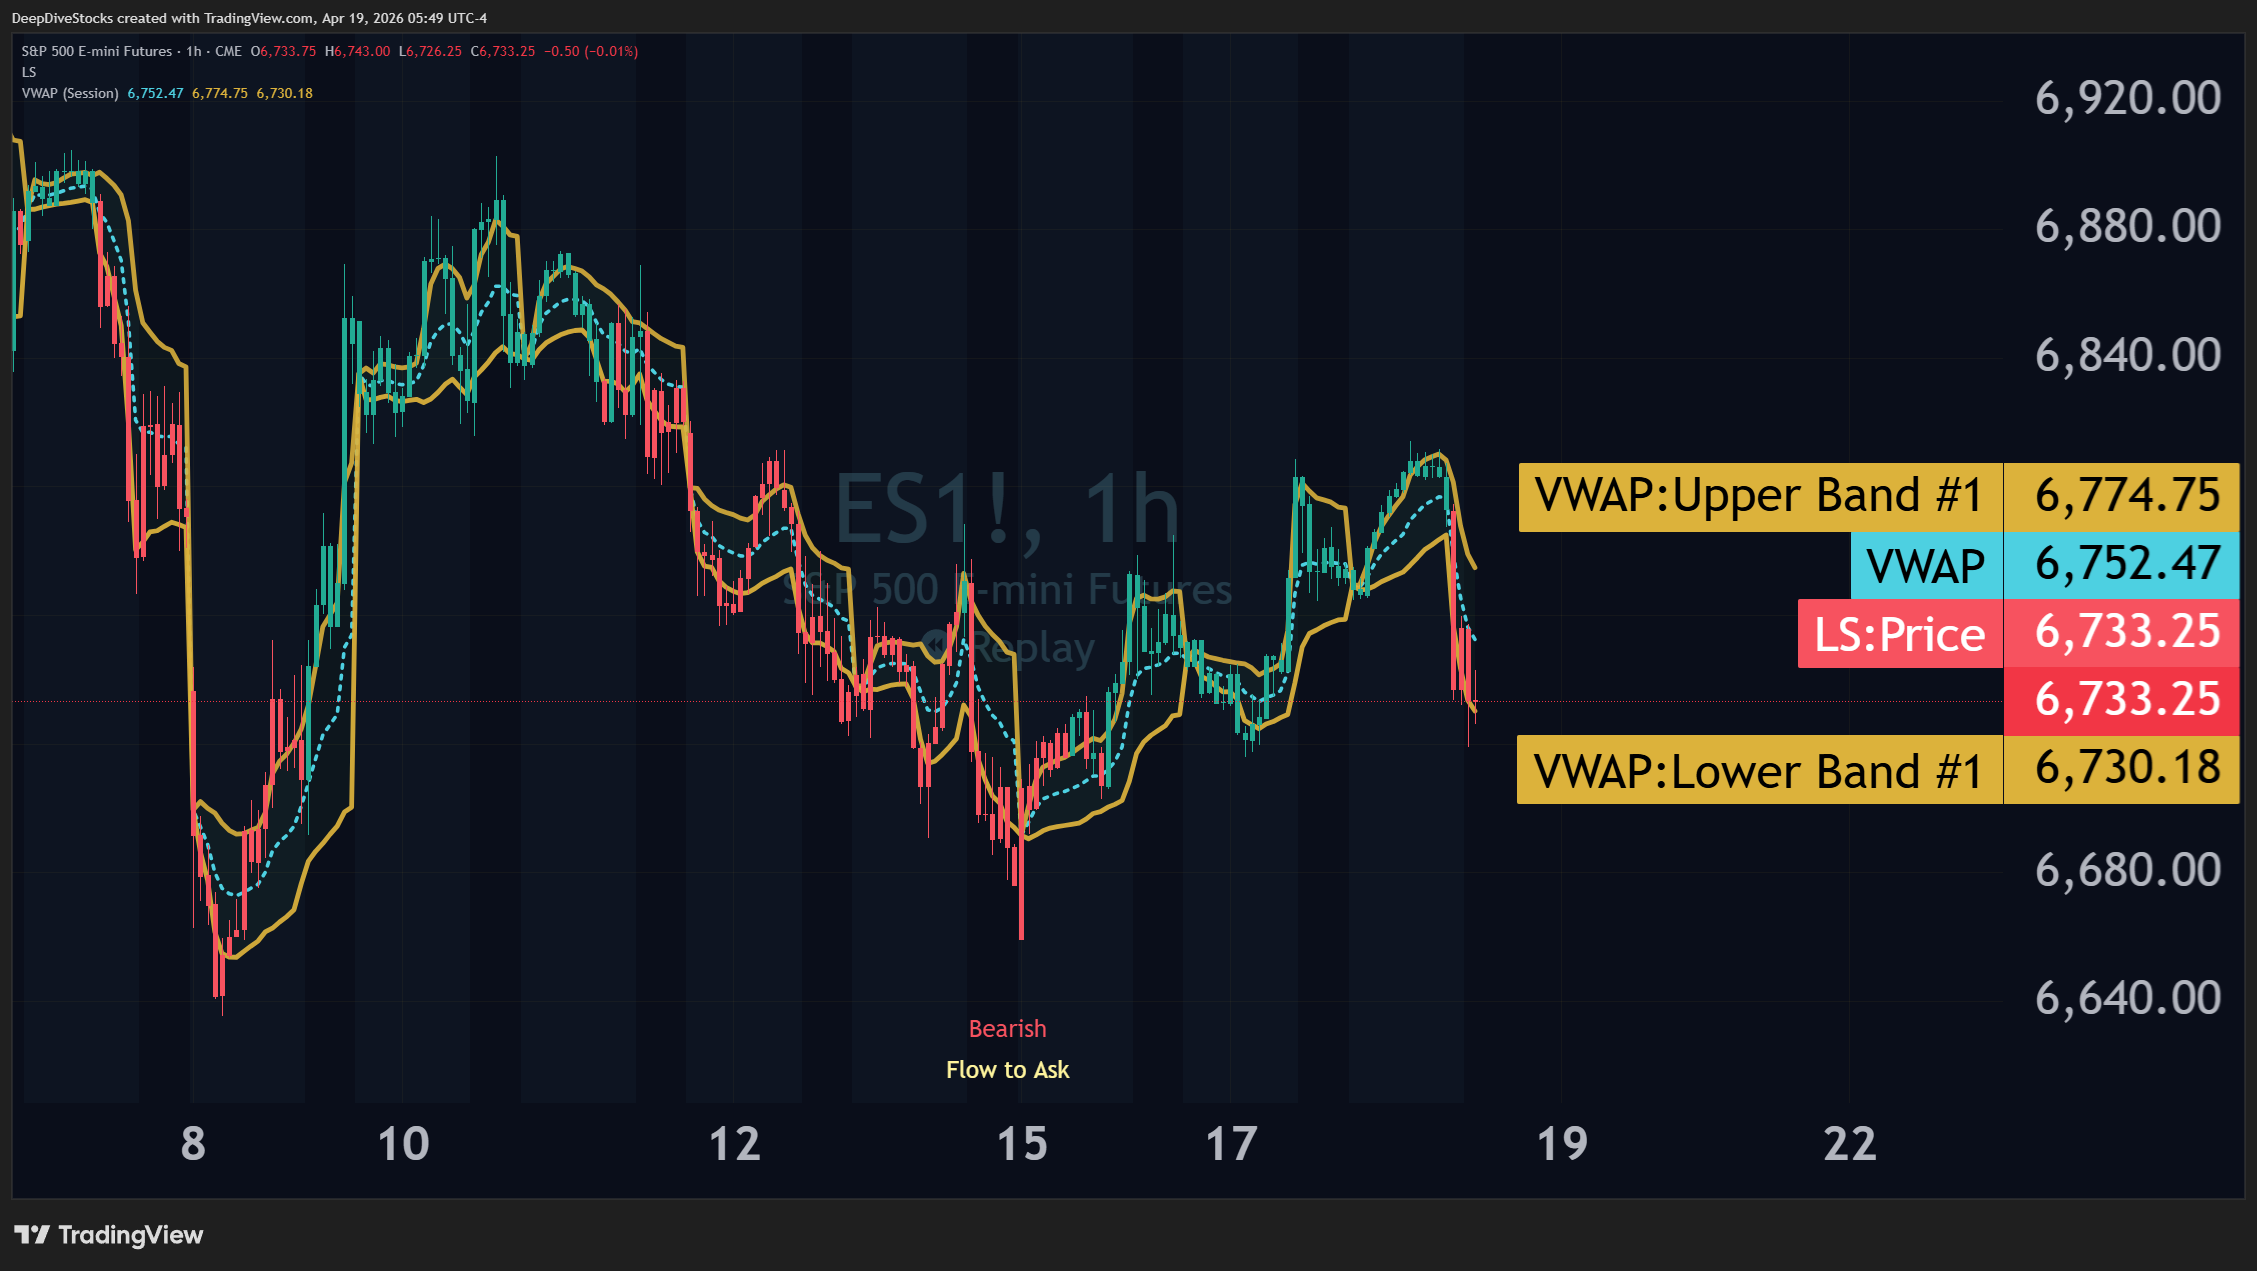
Integrating Liquidity Status into VWAP transforms an ordinary indicator into a predictive insights.
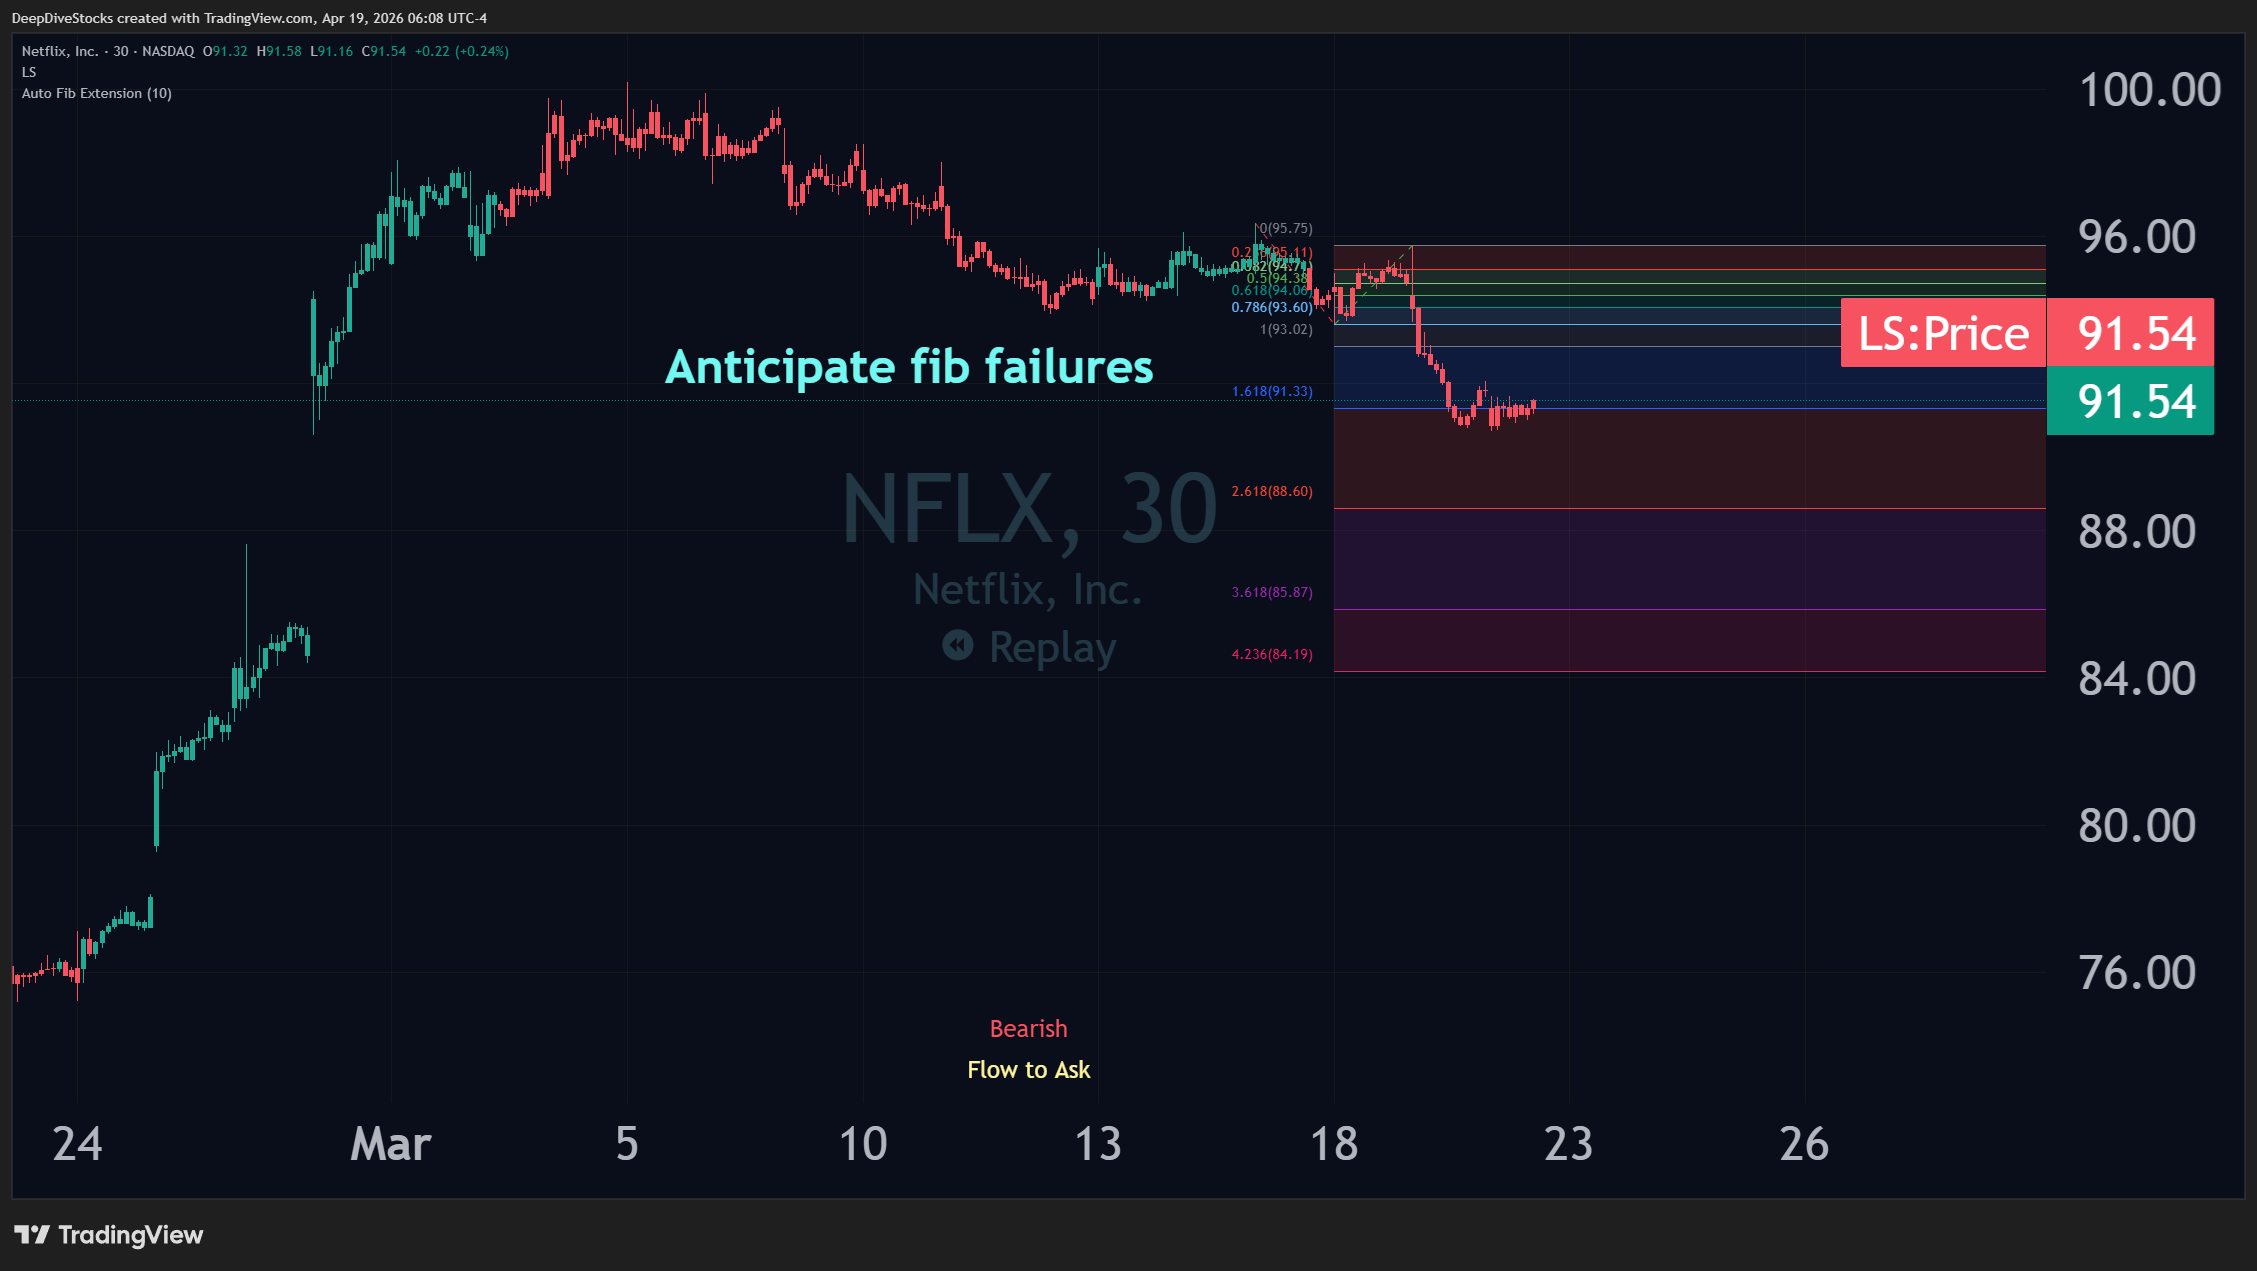
Even when using Fib retracements to anticipate levels, Liquidity Status can be a powerful ally.
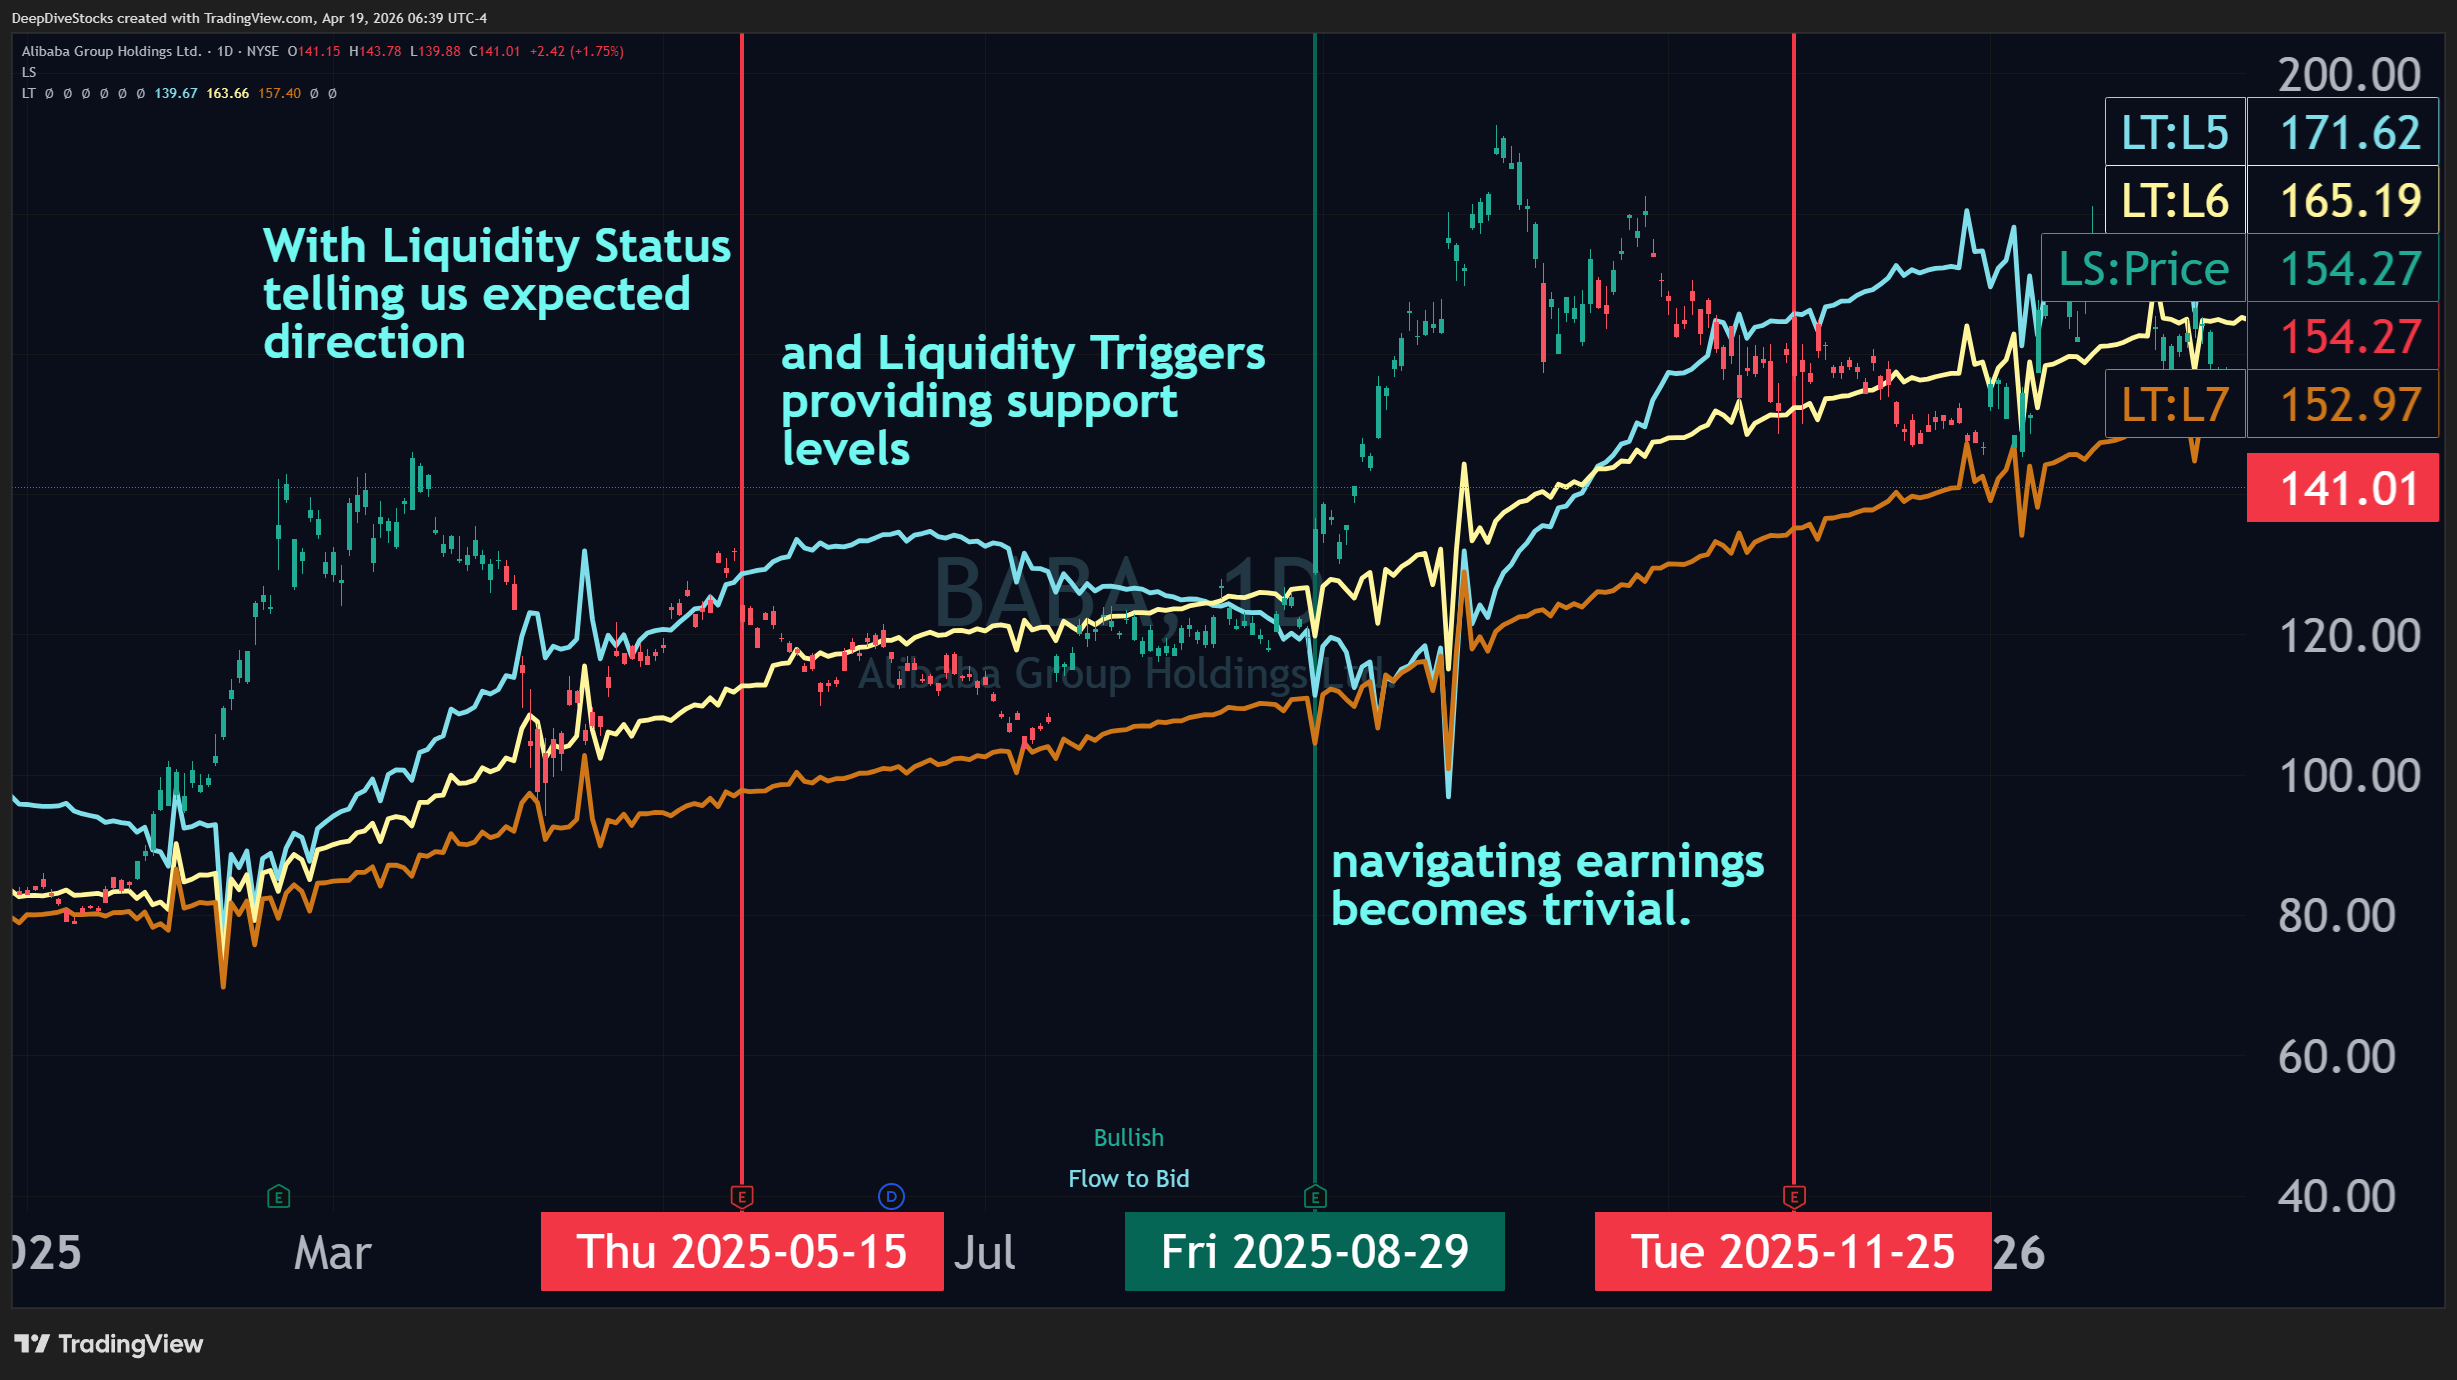
With Liquidity Status and Liquidity Triggers, even earnings lose their mystique as positioning condences ahead of the event.
- Liquidity analysis integrates seemlessly into pre-existing models.
- Liquidity Status-colored price candles compliment traditional TA, helping to add dimension of understanding.
- Monitoring positioning of eager and organic investors before upcoming market events can help identify reliable market positioning and sentiment.
- Minimal cognitive overhead - Liquidity Status-colored candles utilize a green to indicate expectatinos are bullish and red to indicate expectations are bearish.
Resilliance
The time spent weaving mental models is not wasted for the Datahead - the more comprehensive the more confidence the model inspires. A seasoned Datahead is rarely caught off-guard.
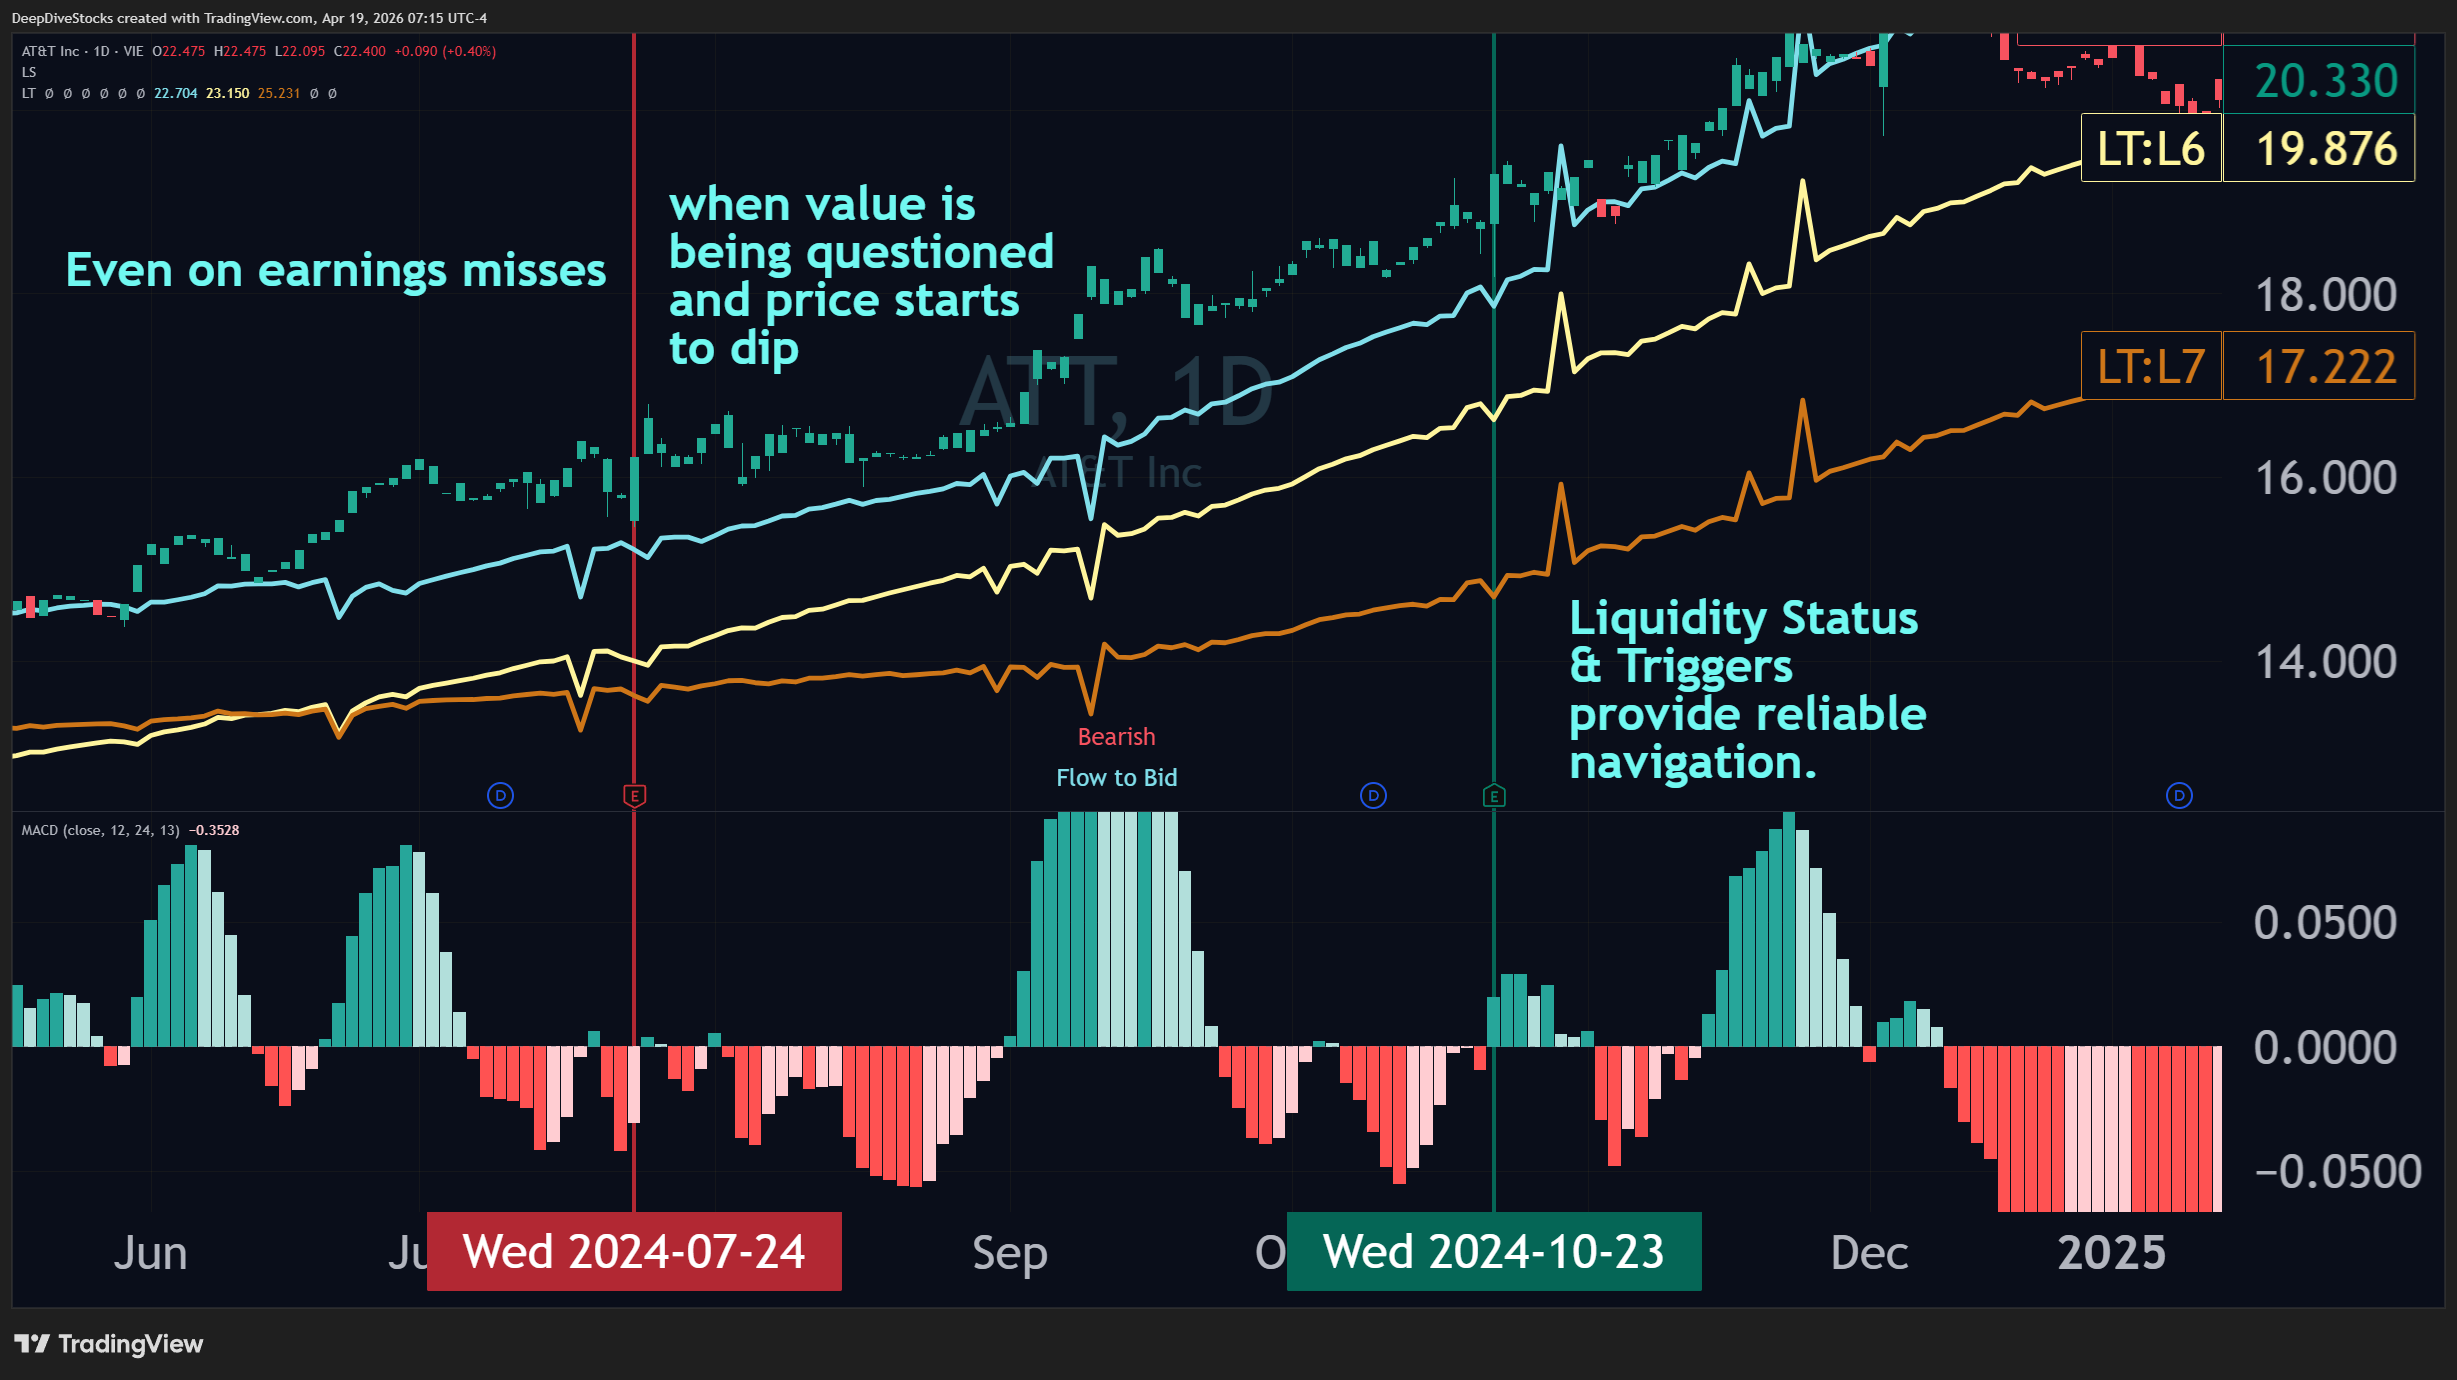
Even when traditional wisdom suggests downside is imminient - such as a missed earnings and negative MACD, Liquidity-Status is here to give us true directional insights while Liquidity Triggers provide liquidity- support levels.
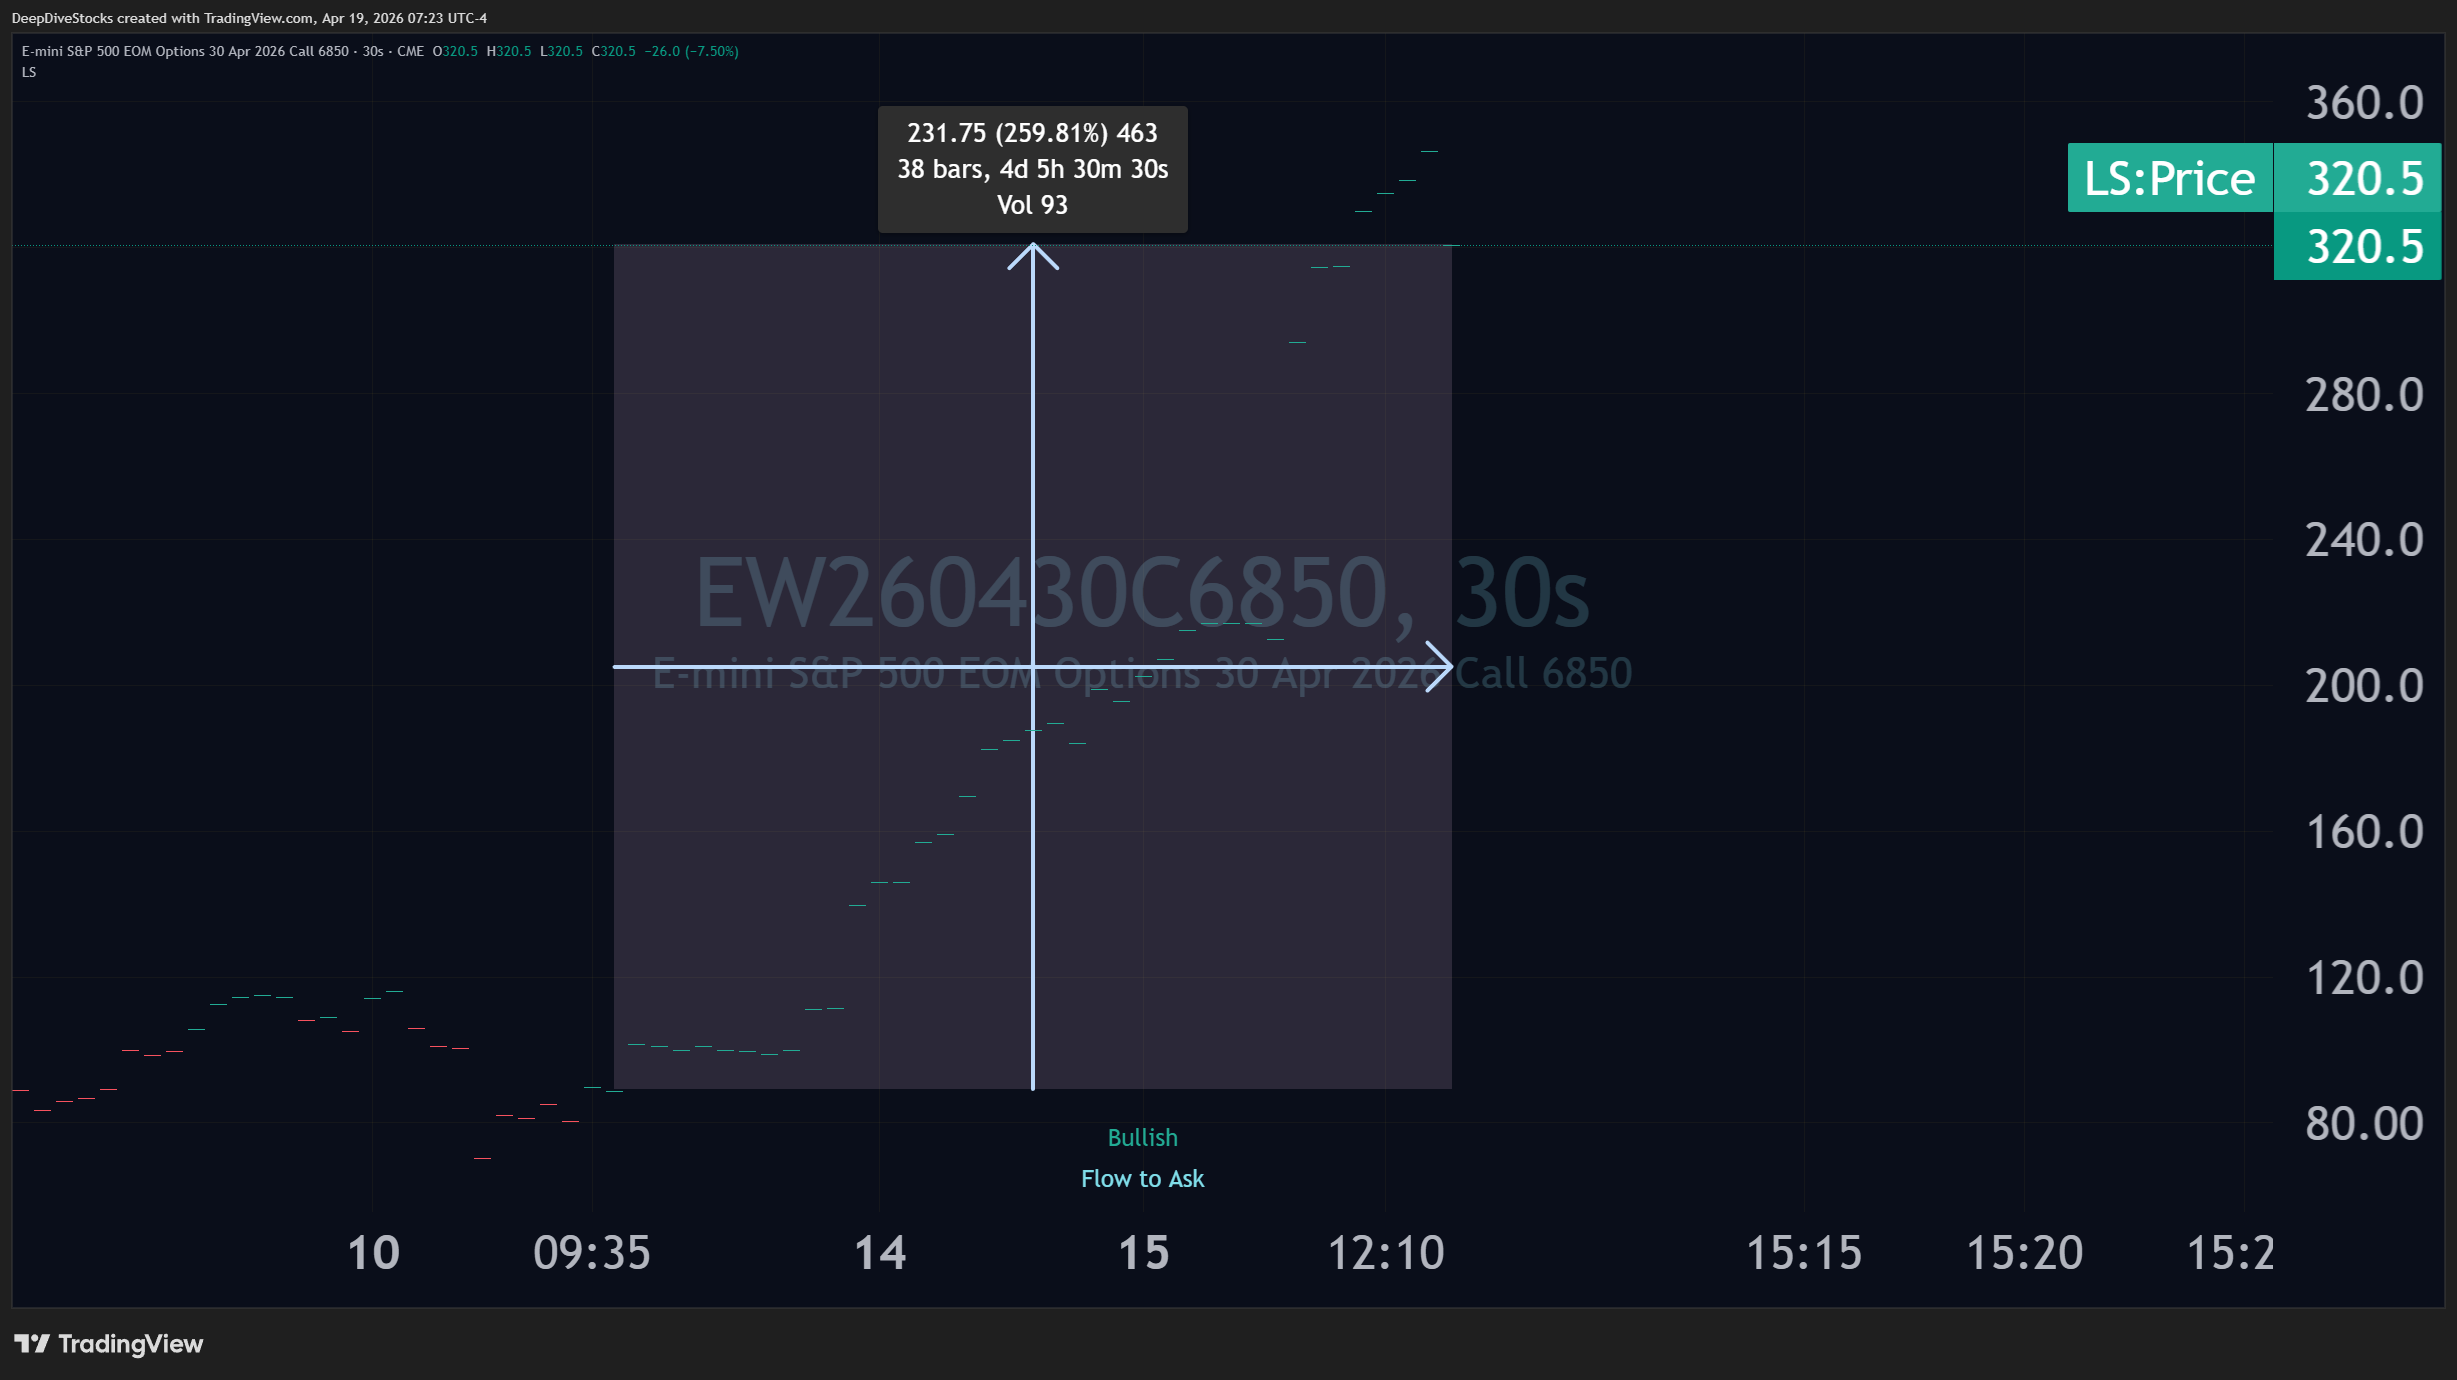
It can be nerve-wracking holding near-dated options - but the Datahead's incorporation of liquidity into their model ensures only increases their confidence and conviction.
- Liquidity Triggers point to where they expect the liquidity stream they are measuring to go, allowing for reliable future support and resistance levels to be identified.
- VoEx is a powerful tool for distinguishing dips from corrections, helping to stabilize and contextualize other data points.
- Identifying the liquidity supplier or liquidity taker while investigating market price-action can be a powerful tool for understanding price dynamics.
Tools of the Trade
Synthesize Liquidity, Derivatives, and Institutional data into a comprehensive view while ignoring the noise and emotion.
VoEx
Detecting cycles hidden under price-action is one of VoExes main strenghts, granting context from darkpool behavior, shorting practices, hedging and even macro economic news well before the market at-large.

Synergistic data, such as Liquidity Status and VoEx, can peel back the mystery of market events - even when the earnings is a beat, there may be structural happenings interferring with the market's response.
- Correlate stability oscillations with earnings releases, press cycles to construct a comprehensive view of expectations and positionings.
- Unlock impactful context to integrate into existing models.
- Monitor for VoEx-daily spikes and forecast price-action over long time horizons.
Liquidity Status
Liquidity Status is arguably the most versatile and impactful indicator - it can accent any and all pre-existing models and systems by simply providing confidence in

Composite charts allow you to directly compare liquidity status between one or several symbols in order to analyze grouped, summed, and even relative (as seen above) liquidity charts. In this case, when the $BTC/$GOLD composite chart is bullish, $BTC is expected to out-perform, while when bearish, $GOLD is expected to outperform.

Re-creating a basket or even a portfolio with Composite Charts allow sensitive and reliable health checks to be performed, identifying any pruning that may be required.
- Composite Charts are unique and powerful - allowing direct visualization of all forms of beta.
- Re-create baskets of symbols to investigate market sectors or even re-construct mock portfolios.
- Immediately identify strong arbitrage opportunities between different exchanges, symbols or sectors.
Keeping Blindspots Covered
Sometimes the Datahead gets distracted and real-life happens fast - don't let anxiety distract you from your performance with these tools.
Bring new and actionable liquidity data into your weaving.
The Nexus of Community and Data
Join a vibrant and data-minded community dedicated to analyzing and sharing insights and patterns to navigate the market.
Connect the dots and connect with community
Even with specialized and streamlined data, the market is a busy place - sharing insights and data with the community allows for collaborative opportunity discovery.
- Sharing insights and data becomes a collaborative effort of market analysis.
- Keep tabs on community sentiment changes as the data changes.
- Utilize the Databot's watchlist to keep track of important names.
- Track the performance of individual Recovery Opportunity alerts.
- Receive daily data of the detected gamma squeezes in the market by requesting and downloading the Databot's .csv file on gamma squeezes!
Discord commands bring the Databot into your hands
The discord allows non-stop access to the Databot for its alerts and for its specialized commands, allowing you to keep tabs on real-time stock data, check in on alert performance, and update and monitor your personalized watchlist.
- The Databot ensures you are always up-to-date with equity and liquidity data.
- Share VoEx findings, liquidity findings, and more in dedicated channels with the community.
- Watchlists allow specialized alerts for Liquidity Status changes as well as Recovery Opportunity Alerts.
Explore an exciting new way to monitor and navigate the markets with Liquidity data.
Explore the Data Depths
Actionable and simple insights powered by liquidity analysis.
With liquidity measurements, we can scan the whole market to determine if bearish or bullish liquidity is growing - and prepare accordingly. Updated every 30 minutes.
- When bullish liquidity is improving, bullish outlooks ahead.
- When bearish liquidity is improving, bearish outlooks ahead.
- 700+ symbols monitored constantly.
Explore an exciting new way to monitor and navigate the markets with Liquidity data.
Monitoring market-sector specific liquidity allows us to monitor real-time flows through the market, updated every hour.
- When bullish liquidity is improving, bullish outlooks ahead.
- When bearish liquidity is improving, bearish outlooks ahead.
- 700+ symbols monitored constantly.
FAQ Section
Still have questions? Contact us and we'll try our best to answer.
Liquidity Status indicates liquidity, liquidity indicates the future.
When a candle is colored green by Liquidity Status, it means the future is bullish - regardless of what price action is doing.
Indicators that change only when the future has changed.
Traditional indicators have a tendancy to change without cause - but not Liquidity Status whose specialized detection and decision algorithm only change when future outlooks have changed.

Liquidity Status is blind to price action - it only reacts when the liquidity conditions have changed sufficiently to alter future expectations. This means it is a powerful tool for navigating bounces and fake-outs.

Patience in the market is rewarded, and with Liquidity Status coloring price-candles based on future expectation, patience is easy to come by. Liquidity Status can help navigate false alarms and fake-outs to help reduce the stress of holding and managing an outlook.
- Replace normal price-candles with liquidity-colored price candles.
- Usable on equities, funds, forex, futures, cryptocurrencies, and options data.
- Customizable to your trading style with the ability to be tuned based on your risk apetite.
- Create Composite Charts and directly compare the grouped-liquidity, liquidity-ratios, or even summed-liquidity on multiple names simaltaneously.
- Monitor multiple timeframes with a toggelable data-table that displays the liquidity status of the 1-minute, 5-minute, 30-minute, 1-hour and 1-day intervals.
Want to get technical?
If you want to dive into the configurations, how to use Liqiudity Status and see many examples, head over to Liquidty Status' page on TradingView.
Liquidity Status helps you avoid Bull and Bear traps with ease.
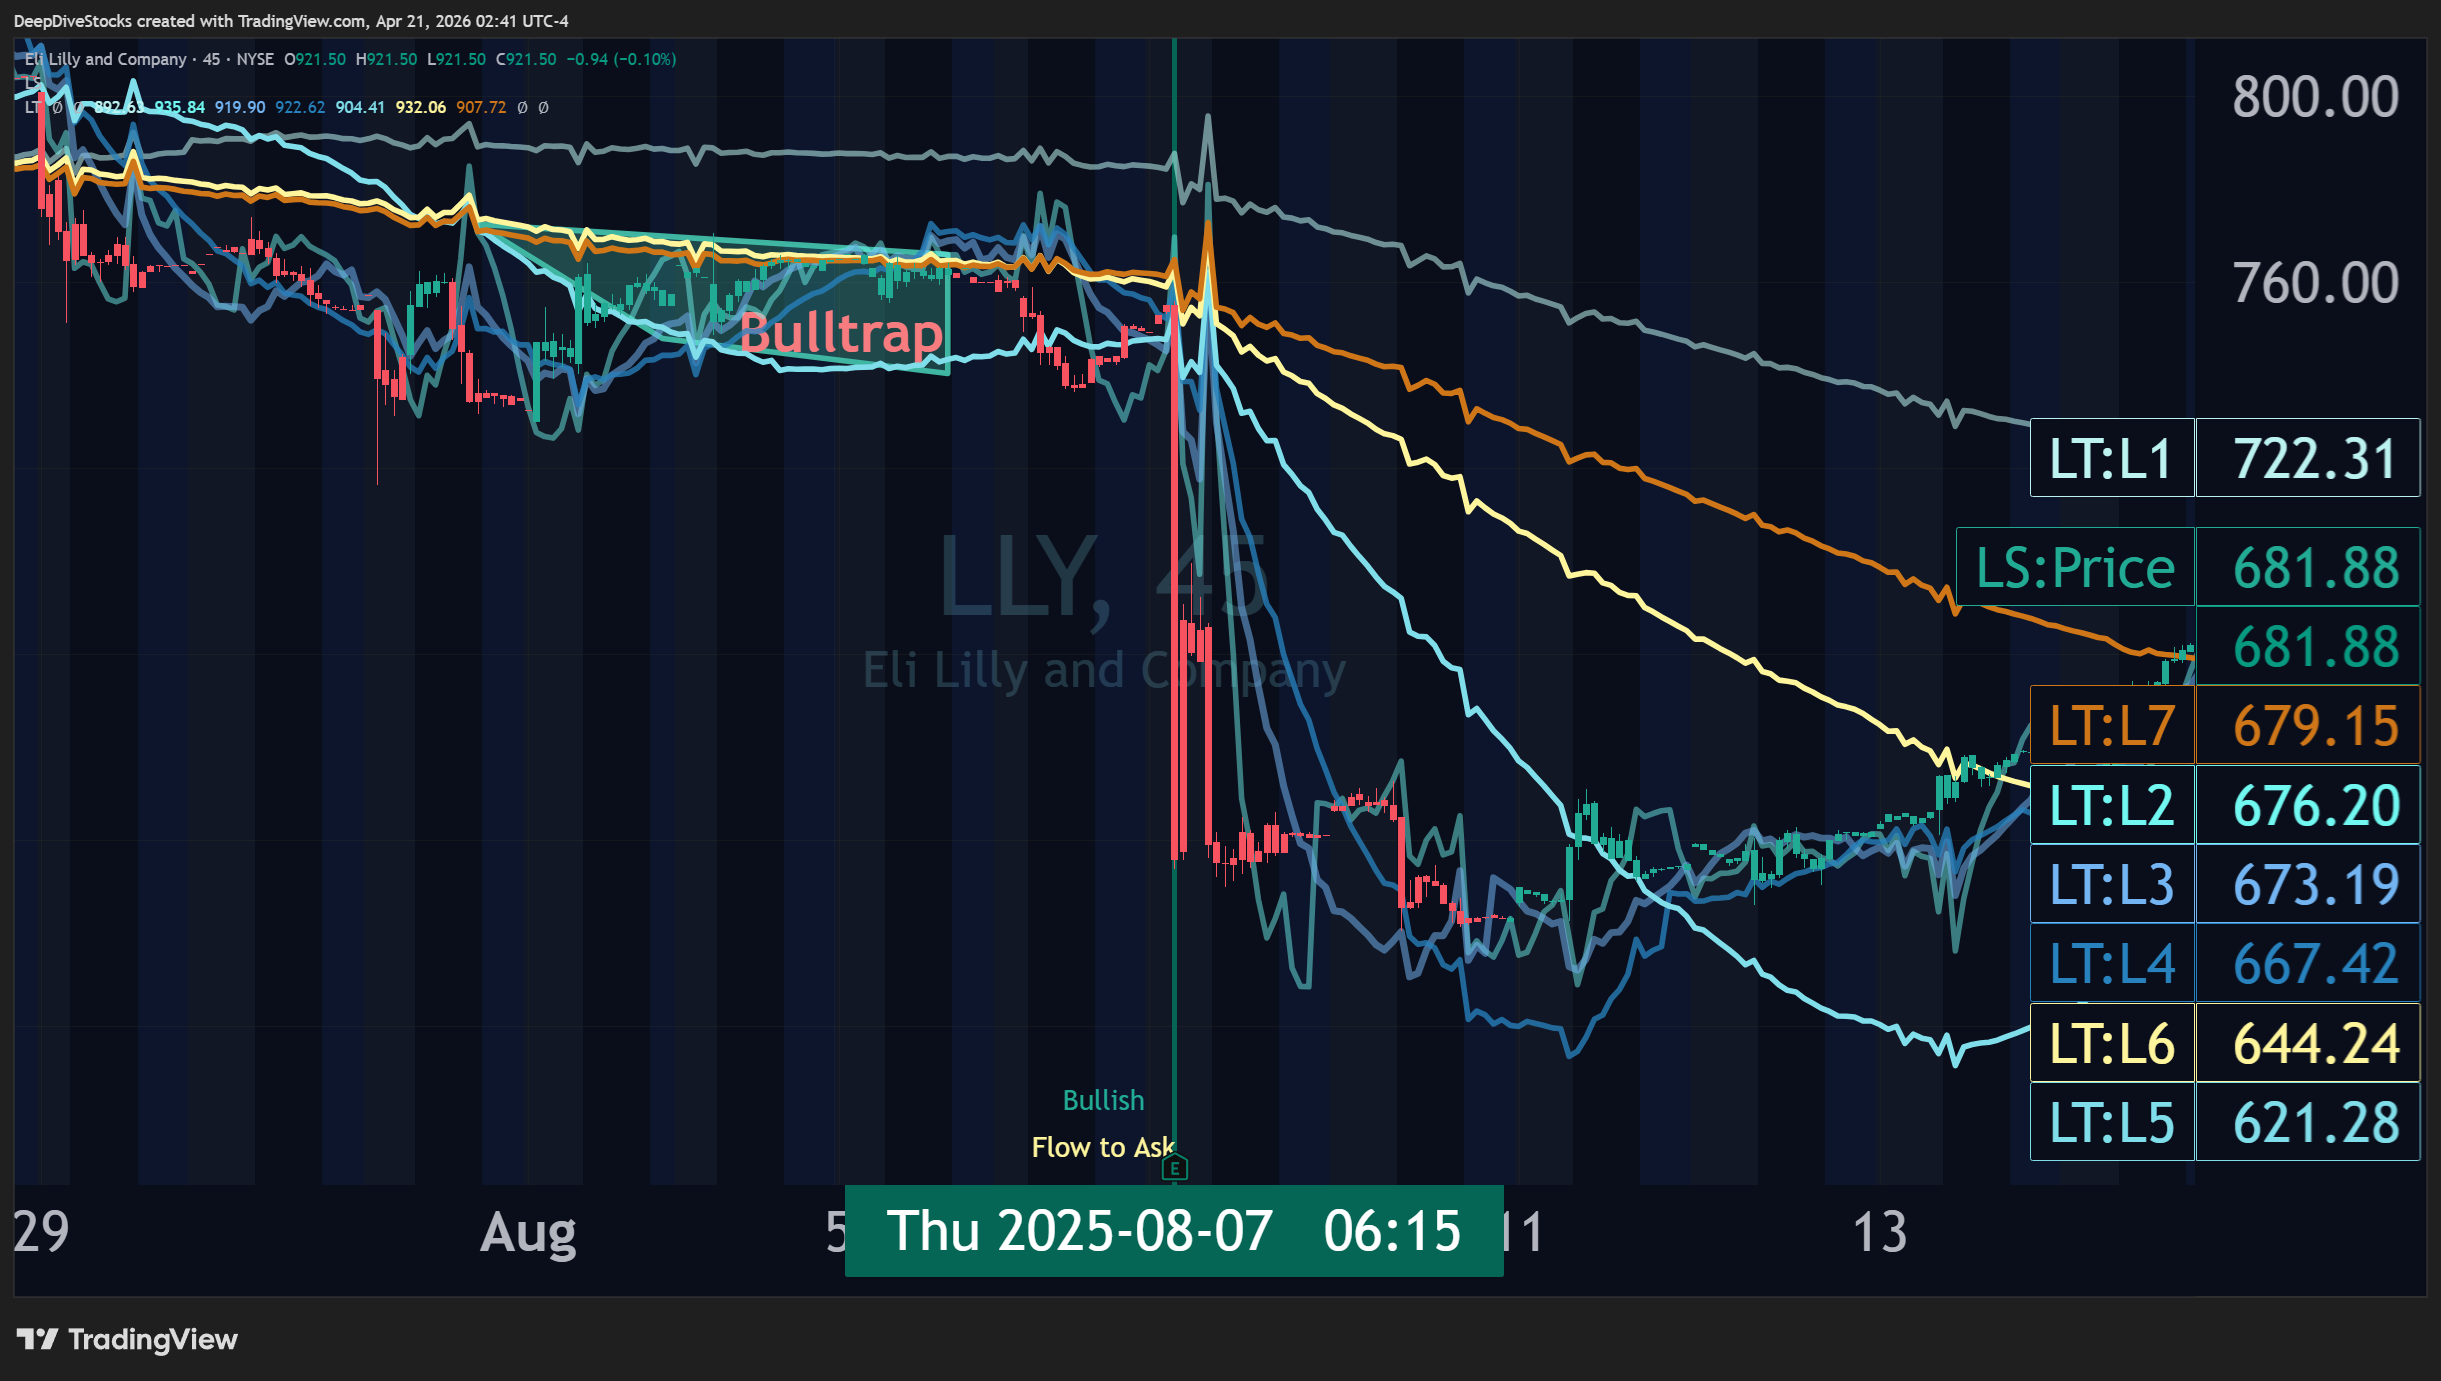
Thanks to the combined views of the Liquidity Status and Liquidty Triggers indicators, it becomes trivial to identify Bulltraps and Beartraps - providing opportunities for quick scalps, hedging or just peace of mind that price-action will return to normal.

Identifying Bull-, and Beartraps becomes trivial with Liquidity Status and Liquidity Triggers, allowing ample time to prepare, hedge, or even play both sides.

When Liquidity Triggers are in a Bullish Stack (LT-5 above LT-6 above LT-7) but Liquidity Status is Bearish - this is a Beartrap. Spot is likley going to be supressed when this starts but recover when it ends.
- Create alerts for non-stop monitoring of liquidity status, liquidity status changes, liquidity flow changes, and suspected bear and bulltraps.
- Identify bull and beartraps before the trap is sprung by identify the trap's start, and monitor conditions as the process progresses.
- Contextualize and understand unusual price-action and set realistic price-point expectations with liquidity-derived support and reistance levels.
- Monitor the dynamic relationship between the liquidity supplier and the liquidity taker.
Start synthesizing high quality liquidity data into your analysis today.
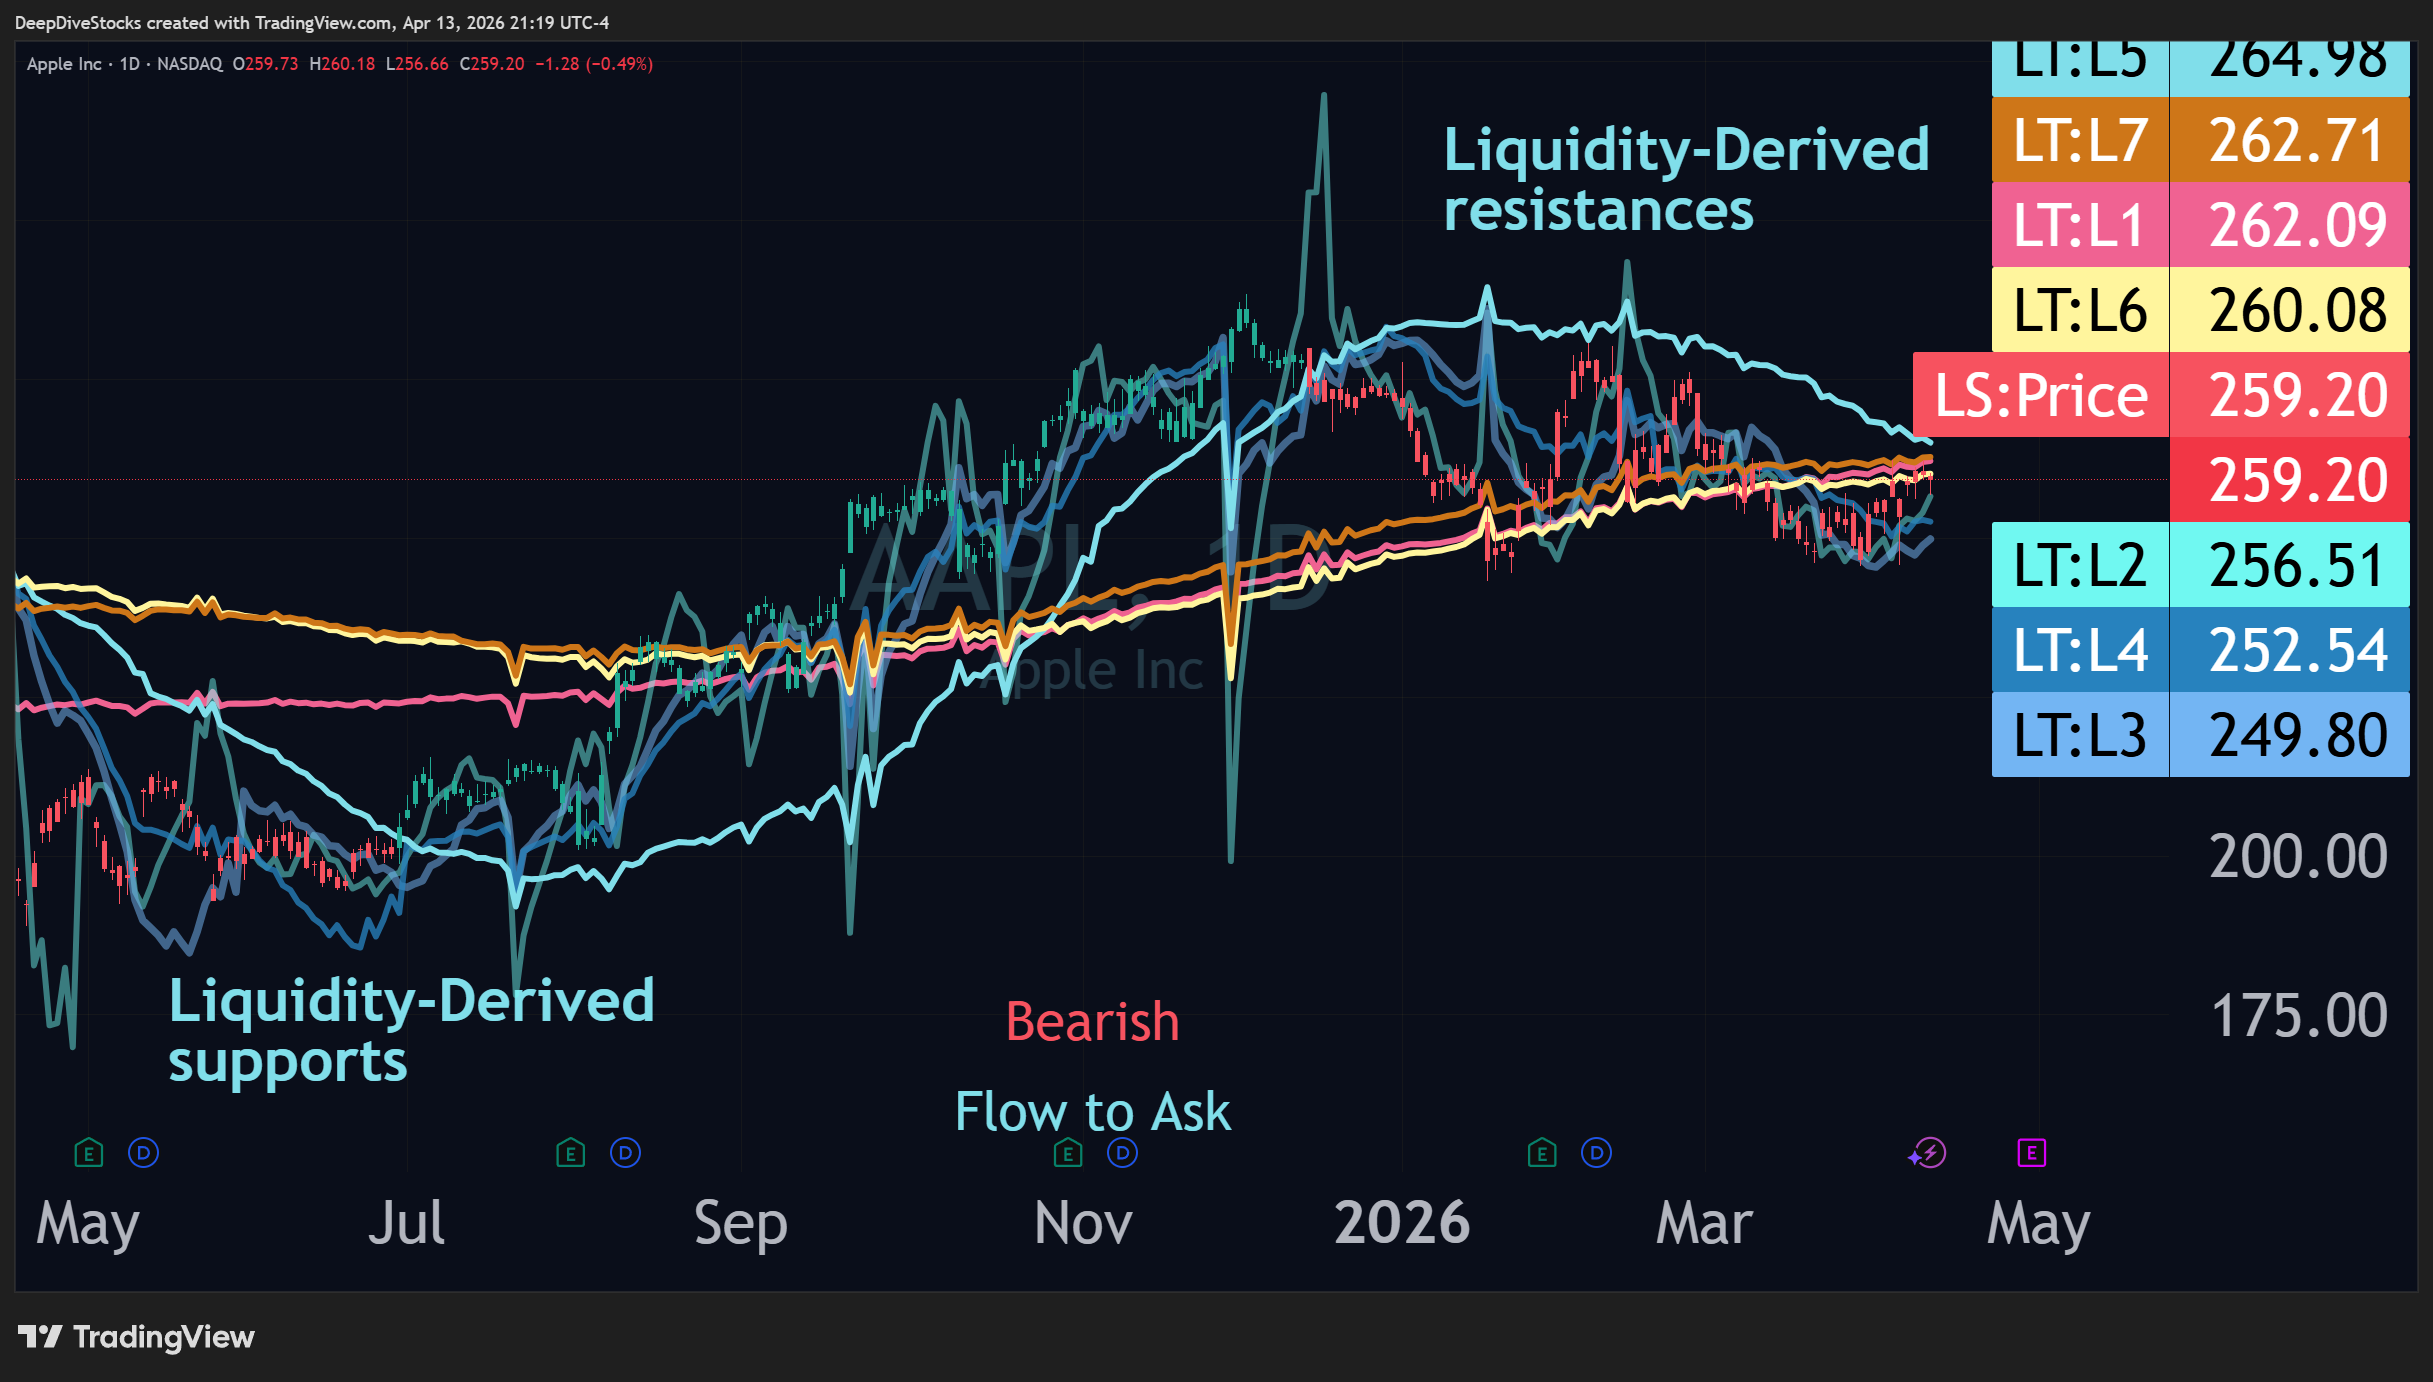
Liquidity Triggers locate levels before they are needed
The Liquidity Triggers are powered by the Liquidity-Dependent Price Movement algorithm, an algorithm designed to find predictive and reliable supports are resistances.
Predictive identification
When you see a Liquidity Trigger, it is not just some randomly drawn line, it is instead an arrow pointing to where the supports or resistances are headed well before spot even knows.

When you measure the flow of liquidity through the market, you can easily track the migration of investors throughout time in a non-chaotic, non-random way. This means that you can anticipate, well ahead of time, where support or resistances are going to be found well before they are met.

The organic liquidity triggers adjust only when they are convinced the level they are measuring is different than they expect. Liquidity Triggers are where supports and resistances are, and they point to where supports are resistances are going to be.

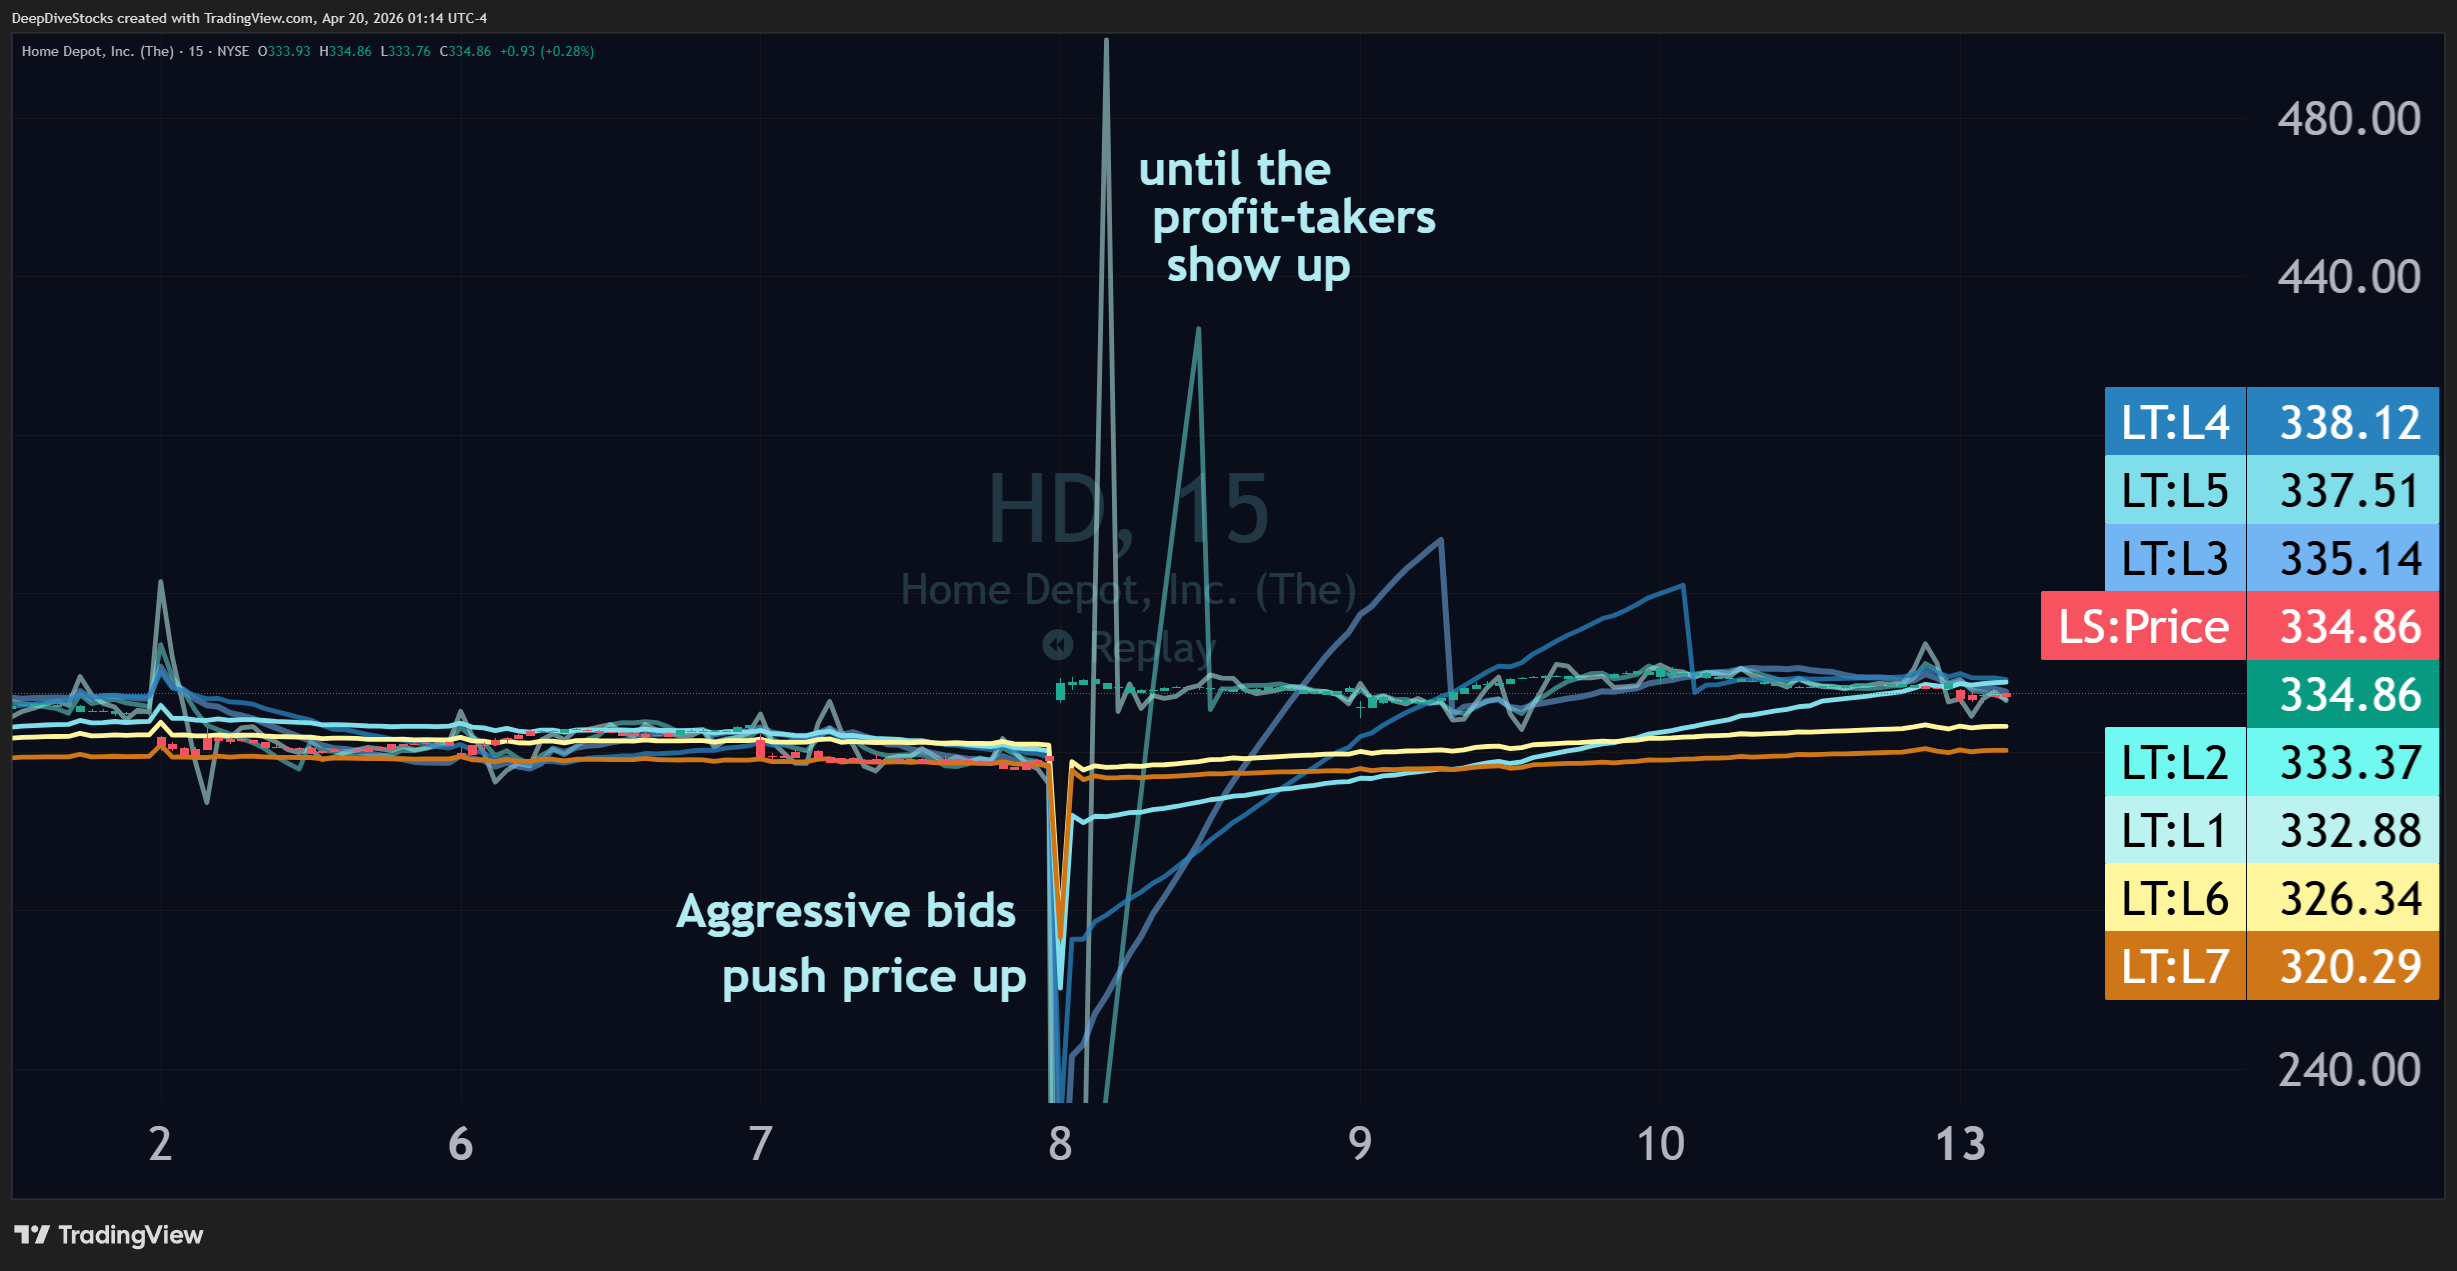
Even the lower-order Liquidity Triggers, which measure the Eager bids and asks, are important levels to monitor. When the dip-buyers move in, this is bullish, and when the profit-takers gather above spot, this is bearish.
- Identify Organic, value-driven liquidity levels, and eager, profit-seeking liquidity levels.
- Monitor the start and progress of Bull-, and Beartraps.
- Construct time-based Liquidity Triggers to monitor supports and resistances levels.
- Monitor Liquidity Triggers across several intervals simaltaneously with the liquidity table.
- Track the entry of Aggressive Bids that push price higher when liquidity is low.
- Track when Aggressive Asks enter, draining liquidity and pushing price down.
- Set alarms to be notified when Aggressive Asks or Aggressive Bids are detected to reduce surprise jumps in price.
Want to get technical?
Dive more into the settings, set-ups, and configurations of the Liquidity Triggers over on the TradingView script page.
Levels with cause and effect
The Liquidity Triggers comprise two groups: the Eagers and the Organics. Knowing where these groups are located is the difference between identifying the peak of a price surge and becoming a victim of FOMO.

When the Organic levels are present below spot, they act as robust supports, and as robust resisances while above spot - it will typically take liquidity to change and multiple attempts to break through.
 on $TSLA")
When the eager Liquidity Triggers (LT-1 through LT-4) move rapidly above spot, the peak of bullish price action has likely been reached and spot will start reverting back down.

When both the Organic and Eager Liquidity Triggers spike in unison, it indicates that something is now absorbing significant liquidity. When the spiking is above spot, it is an Ask (bearish finding!) and when it is below spot, it is a Bid (bullish finding!). These Aggressive Bid/Ask cascades tend to significantly alter price action.
- Identify Organic, value-driven liquidity levels, and eager, profit-seeking liquidity levels.
- Monitor the start and progress of Bull-, and Beartraps.
- Construct time-based Liquidity Triggers to monitor supports and resistances levels.
- Monitor Liquidity Triggers across several intervals simaltaneously with the liquidity table.
- Track the entry of Aggressive Bids that push price higher when liquidity is low.
- Track when Aggressive Asks enter, draining liquidity and pushing price down.
- Set alarms to be notified when Aggressive Asks or Aggressive Bids are detected to reduce surprise jumps in price.
Where Liquidity, Derivatives, Hedging and Darkpool combine forces - join today.
Sophisticated alerts so that you don't miss out on any opportunity
Its important to have a dedicated system for finding opportuniites in the market, but any trader can tell you that it is exhausting constantly keeping track of it all - that's where the Liquidity Toolkit comes in.
Combine Liquidity Status with Price Triggers for a robust view
Liquidity Status matches well with most traditional systems, and none more so than the Price Triggers - Liquidity Status tells you which direction, and the Price Triggers indicate market-preferred price levels. Together, the Toolkit gives you a heading and a destination.

When you combine Liquidity Status with traditional indicators, the benefit is multiplicative: the Liquidity Status gives you the overall directional expectation and the market-derived Price Triggers indicate where previous price accumulation has occured.

Together, the Price Triggers give a good market-consensus for supports and resistances, which pairs eloquently with the directional insights provided by the Liquidity Status-colored price candles.

A Bullplane can be a powerful event - often causing substantial price appreciation once spot is squeezed between two Price Triggers and bullish liquidity takes over.
- Transform non-predictive price-candles into liquidity-colored, predictive candles.
- Reliably identify market-powered support and resistances with the Price Triggers.
- Monitor for unique set ups such as the Bearplane and Bullplane.
Want to get technical?
See how the Liquidity Toolkit provides a comprehensive and reliable introduction to utilizing liquidity data.
Identifying and alerting impactful events in the market - nonstop
The Liquidty Toolkit comes with many alerts designed to identify high-impact changes in the market, from the Recovery Opportunity alert to liquidity-status changes alerts, you can worry less about missing a chance to participate in market events.
When you combine Liquidity Status with traditional indicators, the benefit is multiplicative: the Liquidity Status gives you the overall directional expectation and the market-derived Price Triggers indicate where previous price accumulation has occured.
Together, the Price Triggers give a good market-consensus for supports and resistances, which pairs eloquently with the directional insights provided by the Liquidity Status-colored price candles.
A Bullplane can be a powerful event - often causing substantial price appreciation once spot is squeezed between two Price Triggers and bullish liquidity takes over.
- Harvest high-yield opportunities with the Recovery Opportunity Alerts.
- 10 customizable alerts from Liquidity Status changes to Price-Trgger crossovers.
- Discover important market-consensus levels with the Price Triggers for the 5-Min, Hourly, Daily, Weekly and Monthly.
Take charge with your analysis with liquidity data
Finding market success at the intersection of narrative and data.
Opportunists wait, they plan, and when conditions and catalysts are perfect, they strike; the Opportunist finds clarity when narrative and data match, which makes liquidity data particularly insightful.
Blending Narrative, Data and Timing
Mergers and bomb-shell reports don't just happen every day, but when they do, the Opportunist is ready - they know how the market should react and now, with Deep Dive Stocks, they know just what liquidity is saying.

Blending news, events and data is easy with Liquidity-Status-colored price-candles and Liquidity-based supports from Liquidity Triggers, which provide valuable liquidity-derived context well ahead of market events.

Even geopolitics has its effects on liquidity as large-scale shifts and concerns manifest in changes in the liquidity supply and absorption, and with the Liquidity Status-colored price-candles the data only add confidence, not confuison.
- Whether the market even is planned or unplanned, liquidity can help navigate the turbulence and bring reason to the madness.
- Be ahead of the regular news cycle with direct measurements of liquidity, which shift as soon as the market does.
Market Awareness
Opportunist live in thes place between value and price, detecting large gaps in this union is easy with Deep Dive Stocks.

With Liquidity Status-colored price-candles, you get to detect real intent and real positioning - even for market-events so chaotic they have their own volatility algorithms.
The space between value and price is never greater than it is at earnings as liquidity often moves price without regard to EPS.
- Liquidity allows for direct insight into real positioning and liquidity flow.
- Liquidity Status allows for proper planning and positioning prior to known market-events.
- Dodge FOMO by monitoring Liquidity Triggers for profit-takers and dip-buyers.
Tools of the Trade
Energized by catalsyts and when data meets story, the Opportunist benefits from analyzing data before known events (earnings, mergers, what have you) as well as utilizing the data during surprises to navigate the short-term and long-term opportunities.
Keeping Blindspots Covered
Contextualize and understand market events with high-quality liquidity data.
Monitor the market relentlessly
Monitoring the market is easy with Deep Dive Stocks' tools - from the Recovery Opportunity Alerts to the liquidity-status change alerts, when a significant shift happens, you'll be the first to know.
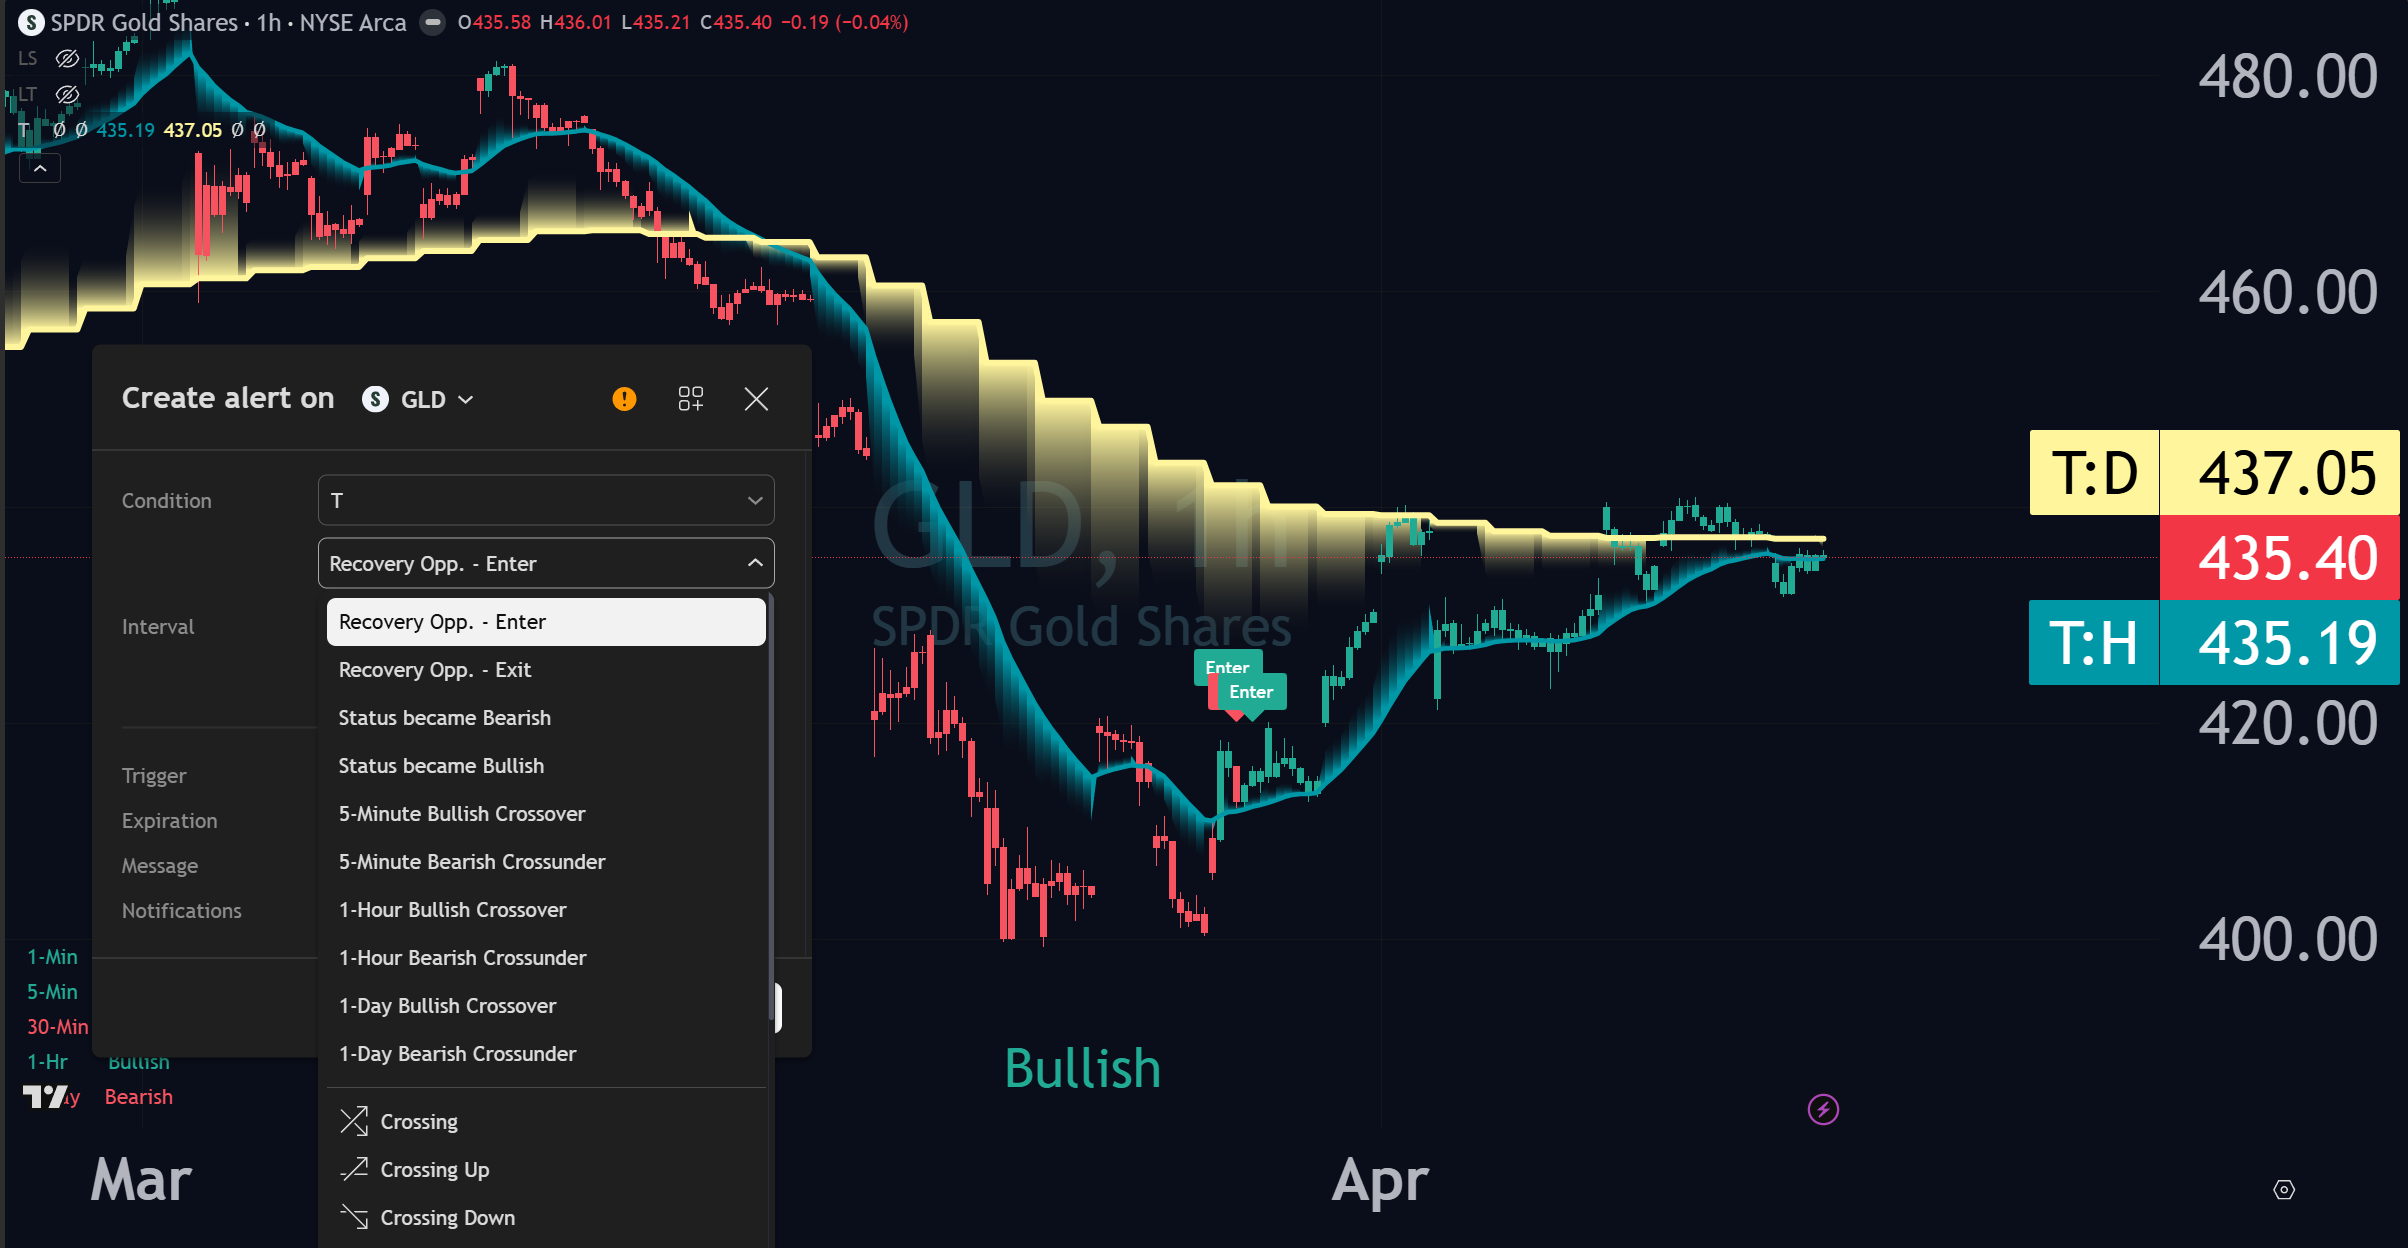
Recovery Opportunity Alerts
The Recovery Opportunity Alerts from the Liquidity Toolkit can monitor any symbol from the 1-minute to the 1-hour for indications of a recovery initiating. With the ability to construct personalized watchlists, this becomes a powerful tool for monitoring large swaths of the market - alerting you only when it counts.

Activating the Recovery Alert Opportunity algorithm on the Liquidity Toolkit activates a powerful monitoring tool that will alert you when a recovery looks promising. Gone are the days of constantly reviewing the same charts over and over looking for something changed, the Toolkit will monitor conditions for you.

Your new liquidity tools are optimized to provide real-time alerts and can operate on entire swaths of the market at once - replicate your portfolio or monitor baskets of options with ease without worrying about missing any opportunities.
- The Databot currently monitors nearly 1,000 symbols on the 5-minute, 30-minute and 60-minute intervals, constantly monitoring for recovery opportunities that have supportiev liquidity environments.
- The Liquidity Status, Triggers and Toolkit contain 28 unique, liquidity-derived alerts.
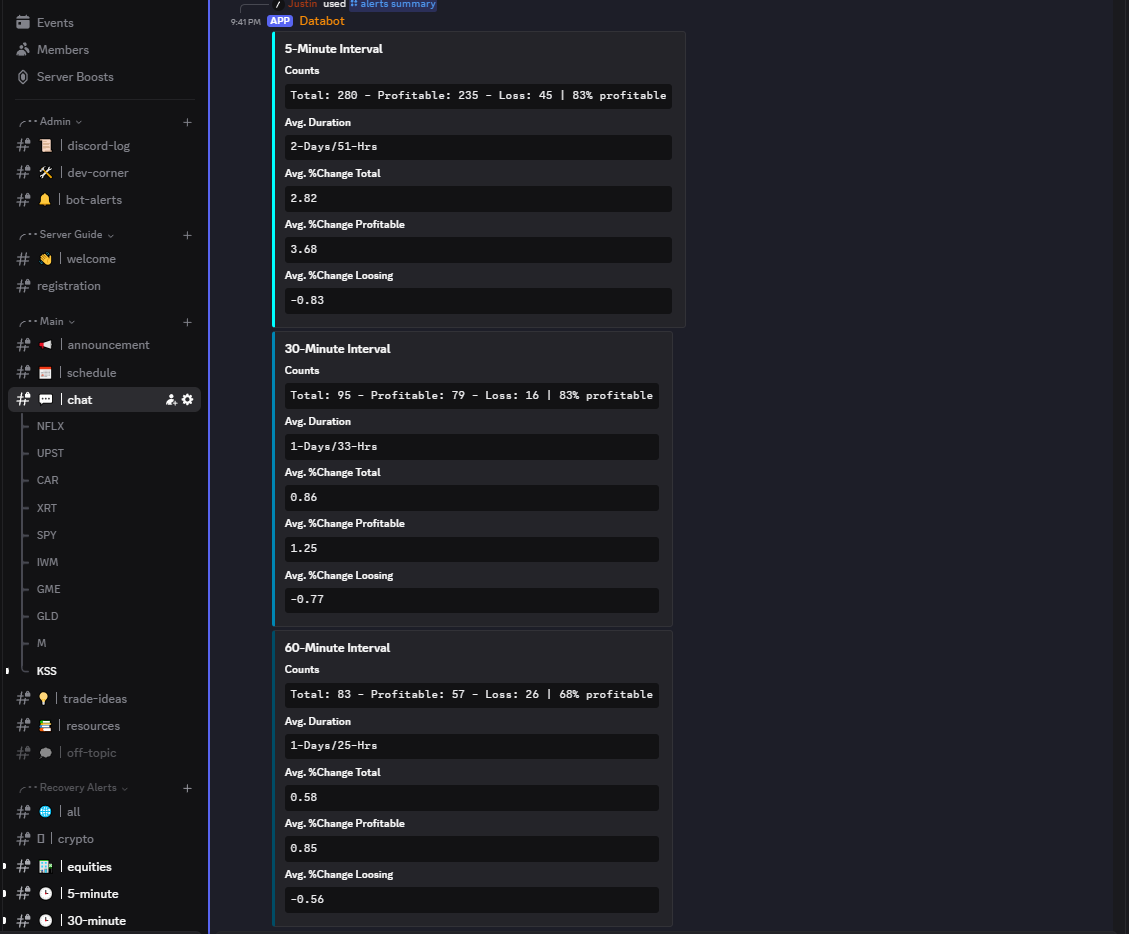
- Check on the performance of the Recovery Opportunity Alerts with the alert summary Databot command.
- The Recovery Opportunity Alerts monitor for signs of a forming price-recovery after a drawdown or correction, making it a powerful tool for deciding when to buy the dip.
Data wherever you go
The Databot will make sure that the alerts you want to keep the closest eye on, will make their way to your attention via its Watchlist and the alerts channel. When you register an alert on your Watchlist, you will recieve a DM form the databot whenever the alert fires, ensuring you are always up-to-date with signficant changes.

The Databot monitors 600+ symbols (equities, cryptocurrencies, forex and futures) for Recovery Opportunities and broadcasts them when they occur so you can spend less time searching for opportunities and more time executing them.

The Databot will keep track of your watchlist and alert you via DM if a specified alert fires for the 600+ (and growing) symbols for the 5-, 30-, and 60-minute timeframes. Set alerts for the Recovery Opportunity Alerts and for Liquidity Status changes.

You can utilize the Databot to get high-quality, real-time price, volume, liquidity status, liquidity trigger and alert information on any of the nearly 1,000 symbols being monitored.
- Liquidity Status changes and Recovery Opportunity Alert events can be added to Databot's watchlist to recieve a DM whenever an event triggers.
- Select from three timeframes, the 5-minute, 30-minute and 60-minute for personalized alerts.
- Take advantage of the Databot's real-time data collection and processing to fetch actionable data wherever you are.
Delegate endless market-searching for opportunities to high-quality, liquidity-backed analysis.
Reflexivity and Pattern Recognition
Like a precision athlete, the scalper enters and exits trades at the perfect moments to maximize performance. With instinct, focus, and precision, the Scalper thrives in fast-moving environments where hesitation and overthinking sell destruction. The Scalper values high quality, clean, and predictive patterns with distinct enter and exit indications.
Pattern Recognition
The Scalper is a pattern-recognizing machine - from traditional candle-patterns to integrating more sophisticated patterns, once a correlation is found, the Scalper is already formulating how to build alpha therefrom.

Bull-, and Bearplanes provide repeatable and reliable set ups for anticipating future price action.

Repeatability and predictability are foundational tennants and the Recovery Opportunity Alerts embody this philosophy by constantly monitoring liquidity conditions searching for the most conducive environments.

Three consecutive Aggressive Bid Cascades demonstrate the reptitive nature of the Liquidity Triggers: when an Aggressive Bid enters, price appreciates until the profit-takers are detected - each and every time.
- The Liquidity Toolkit provides actionable set-ups over and over again.
- The Recovery Opportunity Alerts along with the Databot constantly monitor the market looking for prime liquidity conditions.
- Aggressive Bid and Ask cascades detected by the Liquidity Triggers deliver expected price performance.
Quick Reflexes
The scalper knows when to think and when to act - and for them, its usually always time to act. Quick reflexes give the scalper the edge when monitoring for the perfect entry and exit.

Liquidity Triggers and Status give ample heads-up to Scalpers of up-coming Bull-, and Beartraps, allowing quick entries and exists while surfing the waves.

Quick reflexes pair well with the Recovery Opportunity Alerts which singal entries when liquidity looks bullish - and thanks to the Databot's watchlist, you can have these alerts DM'd directly to you.
- Confidently ride market waves with Bear-, and Bull-trap identification.
- Take advantage of those quick reflexes with the Recovery Opportunity Alerts and personalized watchlist.
- Let the Databot help you monitor the market with non-stop, 24/7 monitoring of over 600 names including equities, futures, cryptocurrencies, forex, and ETFs.
Tools of the Trade
Fast reflexes and confidence define the Scalper and by feeding their pattern-recognition superpowers with high quality, predictive data, the Scalper has every tool at their disposal to enter quickly and exit at the first sign of trend-reversal.
Alerts & Databot
The scalper should spend more time planning and executing than constantly checking the market for updates on potential and open opportunities - let the Alerts and Databot search through the haystack for you.

Construct your own watchlists on TradingView to get an even more personalized liquidity monitoring.

There are a lot of opportunities in the market, and this is evident when checking in on the Active Opportunity Alerts' summary performance via the Databot, where you can keep track of how the alerts are going.

Even keeping track of open opportunities is straightforward with the Databot, whose can fetch real-time liquidity and price data for you whenever you need to check in on the maret.
- Recovery Opportunity Alerts are managed by the Liquidity Toolkit.
- Designed to find liquidity conditions favorable to the start of a price recovery.
- The Databot monitors the market 24/7 for these events, and when they are found, alerts are issued.
- The Databot has several commands designed to help summarize real-time, current information.
Liquidity Toolkit
The Liquidity Toolkit comes with baked-in opportunity finding as well as unique and predictive set ups such as the Bullplane and Bearplane, both of which can provoke powerful and anticipated price action.

A Bullplane is a unique set up found only on the Liquidity Toolkit - it's the compression of price by Price Triggers followed by a flip to Bullish liquidity, often leading to substantial price appreciation.

Bearplanes are the opposite but the set up and expectations are the same: when prce is compressed and swaps Liquidity flips to bearish, downsde is expected.
- The Liquidity Toolkit provides unique and predictable set ups known as the Bullplane and Bearplane.
- Finding opportunities can take the greatest amount of time - let Deep Dive Stocks' tools and Databot start narrowing screening the market for you.
- Customized alerts can be set both within TradingView and with the Databot so an opportunity is never missed.
Keeping Blindspots Covered
The Scalper might loose the forest from the trees - thankfully checking in on the forest is as easy as it gets.
VoEx
Keeping tabs on the overall stability is straightforward with VoEx - checking to see which zone VoEx is in can save you from fighting against the tide, even with a solid set up.

Ensuring confluence between VoEx and potential opportunities is a great way to avoid being sidelined but extreme price action with no forewarning.

When multiple data are congruent, confidence is highest; here we have a Bulltrap as identified by Liquidity Status and Liquidity Triggers along with the VoEx determination of a Bulltrap as well.
- To avoid tunnel vision, the Scalper has VoEx at his disposal to ensure congruence with expected performance of a given set-up.
- Ensure maximum success with congruence acrosss
Liquidity Triggers
Liquidity Triggers identify profit-takers and dip-buyers, along with levels of support and resistance, making them great data to check with while planning an opportunity.

To avoid the blinders, checking for the presence of profit-takers or dip-buyers (LT-1 to LT-4) can quickly make or break a potential opportunity, ensuring only those most likely to succeed are held onto.
Sometimes knowing when not to scalp is just as important - Liquidity Triggers remove FOMO by clearing indicating when a peak has been reached by showing the presence of profit-takers (LT-1 through LT-4) moving above price.
- Confluence is key to keep tunnel vision from taking over.
- Checking with other liquidity data is simple, effective and seemless.
- Liquidity Triggers can show the prescence of profit-takers and dip-buyers - signs that peaks and bottoms have likely already been reached.
Bring an additional layer of confidence to your reflexes with actionable liquidity data.
Start monitoring market dynamics through the lens of liquidity today.
Sophisticated data, simple interpretation.
Data is meant to make decision-making in the market easier, not more complicated - yet instead of focusing on planning and executing trades, so many traders are caught wrestling their indicators for clear signals - but not at Deep Dive Stocks.
Color-Coded Futures
Monitoring and interpreting liquidity data can be very difficult but at Deep Dive Stocks, the process has been steamlined to the extreme: with Liquidity Status painted candles, green means up and red means down.

With the Liquidity Status indicator, when a candle is green, it is telling us that the future is bullish, and when the candle is red, the fuure is bearish.

Identifying the peaks of a bullish run and the bottom of bearish naps becomes trivial with the Liqiudity Toolkit's ability to color price-candles based off of the Liquidity Status algorithm.

The Liqiudity Toolkit, and Liquidity Status indicators both color the price-candles per liquidity to indicate future expectations, and they work on nearly all instrument types and intervals, from cryptocurrency, to equities, to funds, to forex, to even options data.

False bottoms and psuedopeaks can ruin a trader's day and a long-planned thesis, but with liquidity-colored price-candles, these become easy to navigate around so you aren't left with exiting (or entering!) too early.
- The Liquidity Toolkit provides liquidity-based price-candle coloring, enabling predictive analysis to seamlessly integrate into your setup.
- The Liquidity Status indicator provides customizable configurations to tailor analysis.
- Both the Liqudity Toolkit and the Liquidity Status indicators have specialized liquidity-based alerts such as alerts for when liquidity status changes.
Floors that support, and Ceilings that don't surprise
Liquidity Triggers are liquidity-derived levels of floors (supports) and ceilings (resistances), indicating where robust levels of organic bids and asks are being observed in the market. Floors support, and ceilings hinder.

A unique feature of the Liquidity Triggers is their ability to detect liquidity-abundant areas before they are needed - sometimes, well in advance, providing significant time to plan and anticipate approaching ceilings and supports.

Combining Liquidity Status and Liquidity Triggers gives potent insight into when supports or ceilings are likely to fail or likely to succeed and cause a bounce. Bearish liquidity into a support is high-risk for the support breaking, while bullish liquidity into a support Liquidity Trigger is promising for a liquidity-charged bounce.
- The Liquidity Triggers indicators allows the detection of supports, resistances, aggressive bids, aggressive asks all in one easy-to-use indicator.
- The Liquidity Toolkit indicator provides Price Triggers to help located price-action dependent levels of support and resistance utilized by many traditional market indicators.
- Reducing the noise from signal becomes easy with high-quality, liquidity-derived alerts available with the Liquidity Triggers, Toolkit & Status indicators.
Declutter, decomplicate and gain clarity with impactful signals.
When liquidity meets derivative analysis
VoEx combines liquidity analysis with derivative and market-maker activiy to identify when conditions are bullish or bearish.
Long-time horizons with minimal worry
VoEx is designed to provide both near and long-term outlooks but it excels in the long-term (when's the last time you heard that?): when VoEx is within the bullish zone, the outook for the future is bullish, and when VoEx is in the bearrish zone, the outlook is bearish.

VoEx is predictive, performant and best of all: easy to understand. VoEx (the gold line) gives us long-term outlooks while VoEx-daily gives us near-term outlooks. VoEx migrating from one zone is predictive for a change in price.

VoEx is fantastic for looking at overall stability on the longer time horizons as it gives ample time to prepare and plan with peace-of-mind that all is well, even during turbulent times.

When VoEx Divergence appears, there is time to prepare but prepare is exactly what you should do - an appreciating price while VoEx trends downwards is a sign of incoming substantial price decline.